Home
Class 8
MATHS
The following pie-chart represents the a...

The following pie-chart represents the amount spent on different sports by a school administration in a calendar year.

If the money spent on football is Rs. 9000, answer the following questions:
(i) If the amount spent on football was Rs. 9000, then how much more money was spent on hockey than on football ?
(ii) If the amount spent on football Rs. 9000, then what was the total amount spent on all sports ?

Promotional Banner

Topper's Solved these Questions

  • DATA HANDLING-II (HISTOGRAMS)

    RD SHARMA ENGLISH|Exercise All Questions|16 Videos
  • DATA HANDLING-IV (PROBABILITY)

    RD SHARMA ENGLISH|Exercise All Questions|39 Videos

Similar Questions

Explore conceptually related problems

The pie chart (as shown in the figure) represents the amount spent on different sports by a sports club in a year. If the total money spent by the club on sports is Rs. 1,08,000, find the amount spent on each sport.

The money spent on the repair of a house was 2% of its value. If the cost of repair is Rs 9600, find the cost of the house.

Anil spent Rs 60 out of Rs 300. What fraction of money is left over?

Write the following sentences into percentage form : रु. 680 out of रु. 800 is spent.

John had Rs 60 with him. He spent 40% of the money he had on a sandwich and the rest on an ice cream. Find the amount he spent on each item.

A player kicks a football of mass 0.5 kg and the football begins to move with a velocity of 10 m/s . If the contact between the leg and the football lasts for (1)/(50) sec , then the force acted on the football should be

Rashid spent Rs 35.75 for Maths book and Rs 32.60 for Science book. Find the total amount spent by Rashid.

Rashid spent Rs 35.75 for Maths book and Rs 32.60 for Science book. Find the total amount spent by Rashid.

Lata spent Rs 9.50 for buying a pen and Rs 2.50 for one pencil.How much money did she spend?

One day a labourer earned Rs. 58""1/2 . Out of this money, he spent Rs. 18""3/4 on food and Rs. 6""1/5 on other needs. How much is left with him?

RD SHARMA ENGLISH-DATA HANDLING-III (PIE CHARTS OR CIRCLE GRAPHS)-All Questions
  1. The following table shows how a student spends his pocket money dur...

    Text Solution

    |

  2. Items of expenditure Expenditure Family A Family B Food 4000 6400 Clot...

    Text Solution

    |

  3. Following data gives the break up of the cost of production of a bo...

    Text Solution

    |

  4. Represent the following data with the help of a pie-diagram: Items,...

    Text Solution

    |

  5. Draw a pie-diagram representing the relative frequencies (expressed...

    Text Solution

    |

  6. Following is the break up of the expenditure of a family on differe...

    Text Solution

    |

  7. Draw a pie-diagram for the following data of the investment pattern ...

    Text Solution

    |

  8. The pie-chart given in Figure, represents the expenditure on differe...

    Text Solution

    |

  9. The pie-chart shown in Figure represents the expenditures of a famil...

    Text Solution

    |

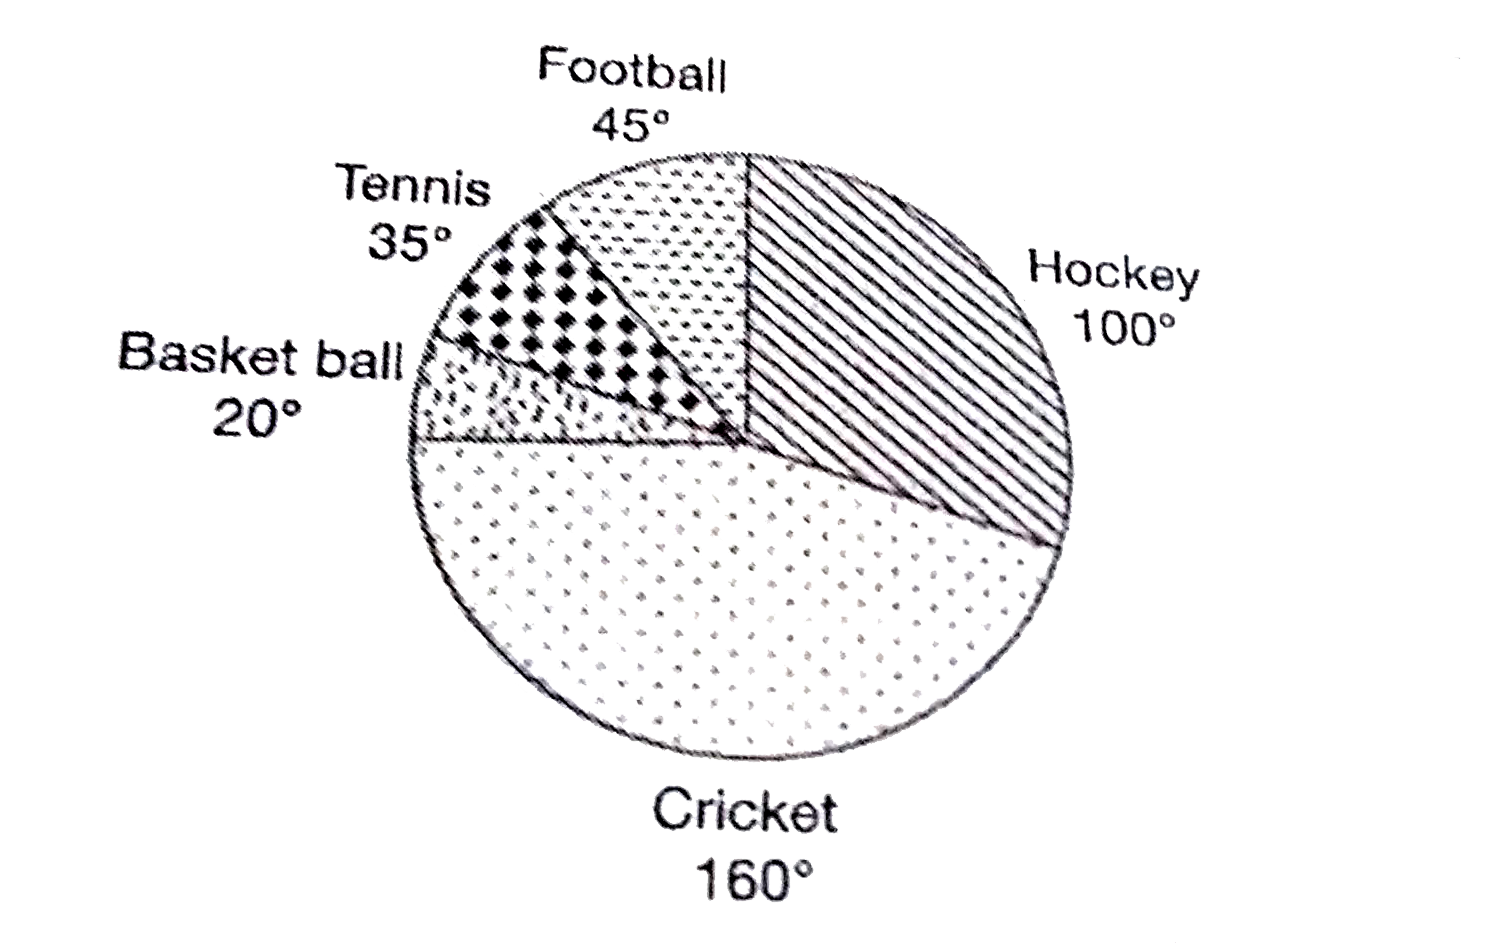
  10. The following pie-chart represents the amount spent on different spo...

    Text Solution

    |

  11. The following pie-chart represents the total number of valid votes ...

    Text Solution

    |

  12. The following pie-chart gives the marks scored in an examination by...

    Text Solution

    |

  13. The following pie-chart shows the monthly expenditure of a family on...

    Text Solution

    |

  14. The pie-chart given in Figure represents the expenditure on differe...

    Text Solution

    |

  15. The pie-chart given in Figure shows the annual agricultural product...

    Text Solution

    |

  16. The following pie-chart shows the number of students admitted in dif...

    Text Solution

    |

  17. In Figure, the pie-chart shows the marks obtained by a student in a...

    Text Solution

    |

  18. In Figure, the pie-chart shows the marks obtained by a student in v...

    Text Solution

    |

  19. The following pie-chart shows the monthly expenditure of Shikha on ...

    Text Solution

    |

  20. The pie chart (as shown in the figure) represents the amount spent ...

    Text Solution

    |