Text Solution
Verified by Experts


Topper's Solved these Questions
REST AND MOTION : KINEMATICS
HC VERMA ENGLISH|Exercise worked out Examples|20 VideosREST AND MOTION : KINEMATICS
HC VERMA ENGLISH|Exercise Objective -1|13 VideosPHYSICS AND MATHEMATICS
HC VERMA ENGLISH|Exercise Question for short Answer|14 VideosROTATIONAL MECHANICS
HC VERMA ENGLISH|Exercise Questions for short Answer|21 Videos
Similar Questions
Explore conceptually related problems
HC VERMA ENGLISH-REST AND MOTION : KINEMATICS-Question for short Answer
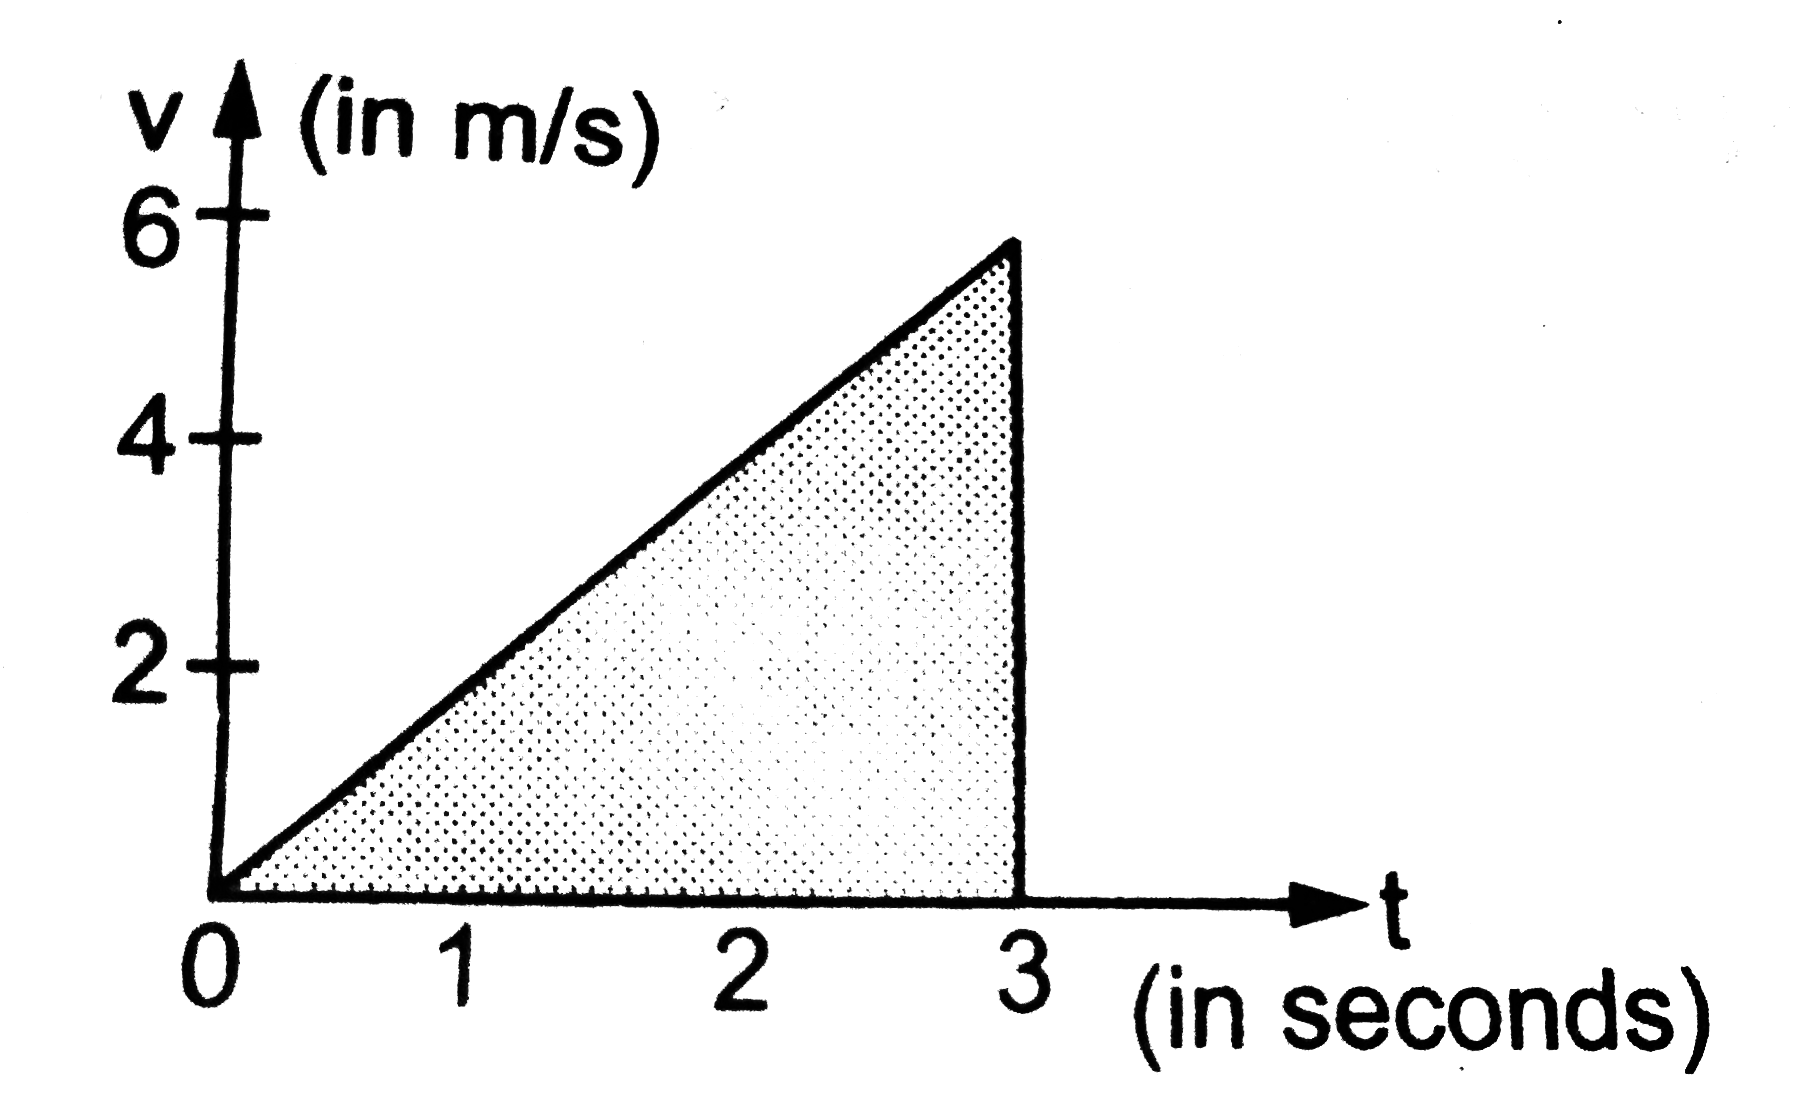
- Figure shows the speed versus time graph for a particle. Find the dist...
Text Solution
|
- Galileo was punished by the Church for teaching that the sum is statio...
Text Solution
|
- When a particle moves with constant velocity, its average velocity, it...
Text Solution
|
- A car travels at a speed of 60 km/hr due north and the other at a spee...
Text Solution
|
- A ball is thrown vertically upward with a speed of 20 m/s. Draw a grap...
Text Solution
|
- The velocity of a particle is towards west at an instant. Its accelera...
Text Solution
|
- At which point on its path a projectile has the smallest speed?
Text Solution
|
- Two particles A and B starts from rest and move for equal time on a st...
Text Solution
|
- If a particle is accelerating it is either speeding up or speeding dow...
Text Solution
|
- A food packet is dropped from a plane going at an altitude of 100 m. W...
Text Solution
|
- Give examples where a. the velocity of a particle is zero but its acce...
Text Solution
|
- A player hits a baseball at some angle. The ball goes high up in space...
Text Solution
|
- The increase in the speed of a car is proportional to the additional p...
Text Solution
|
- Rain is falling vertically. A man running on the road keeps his umbrel...
Text Solution
|