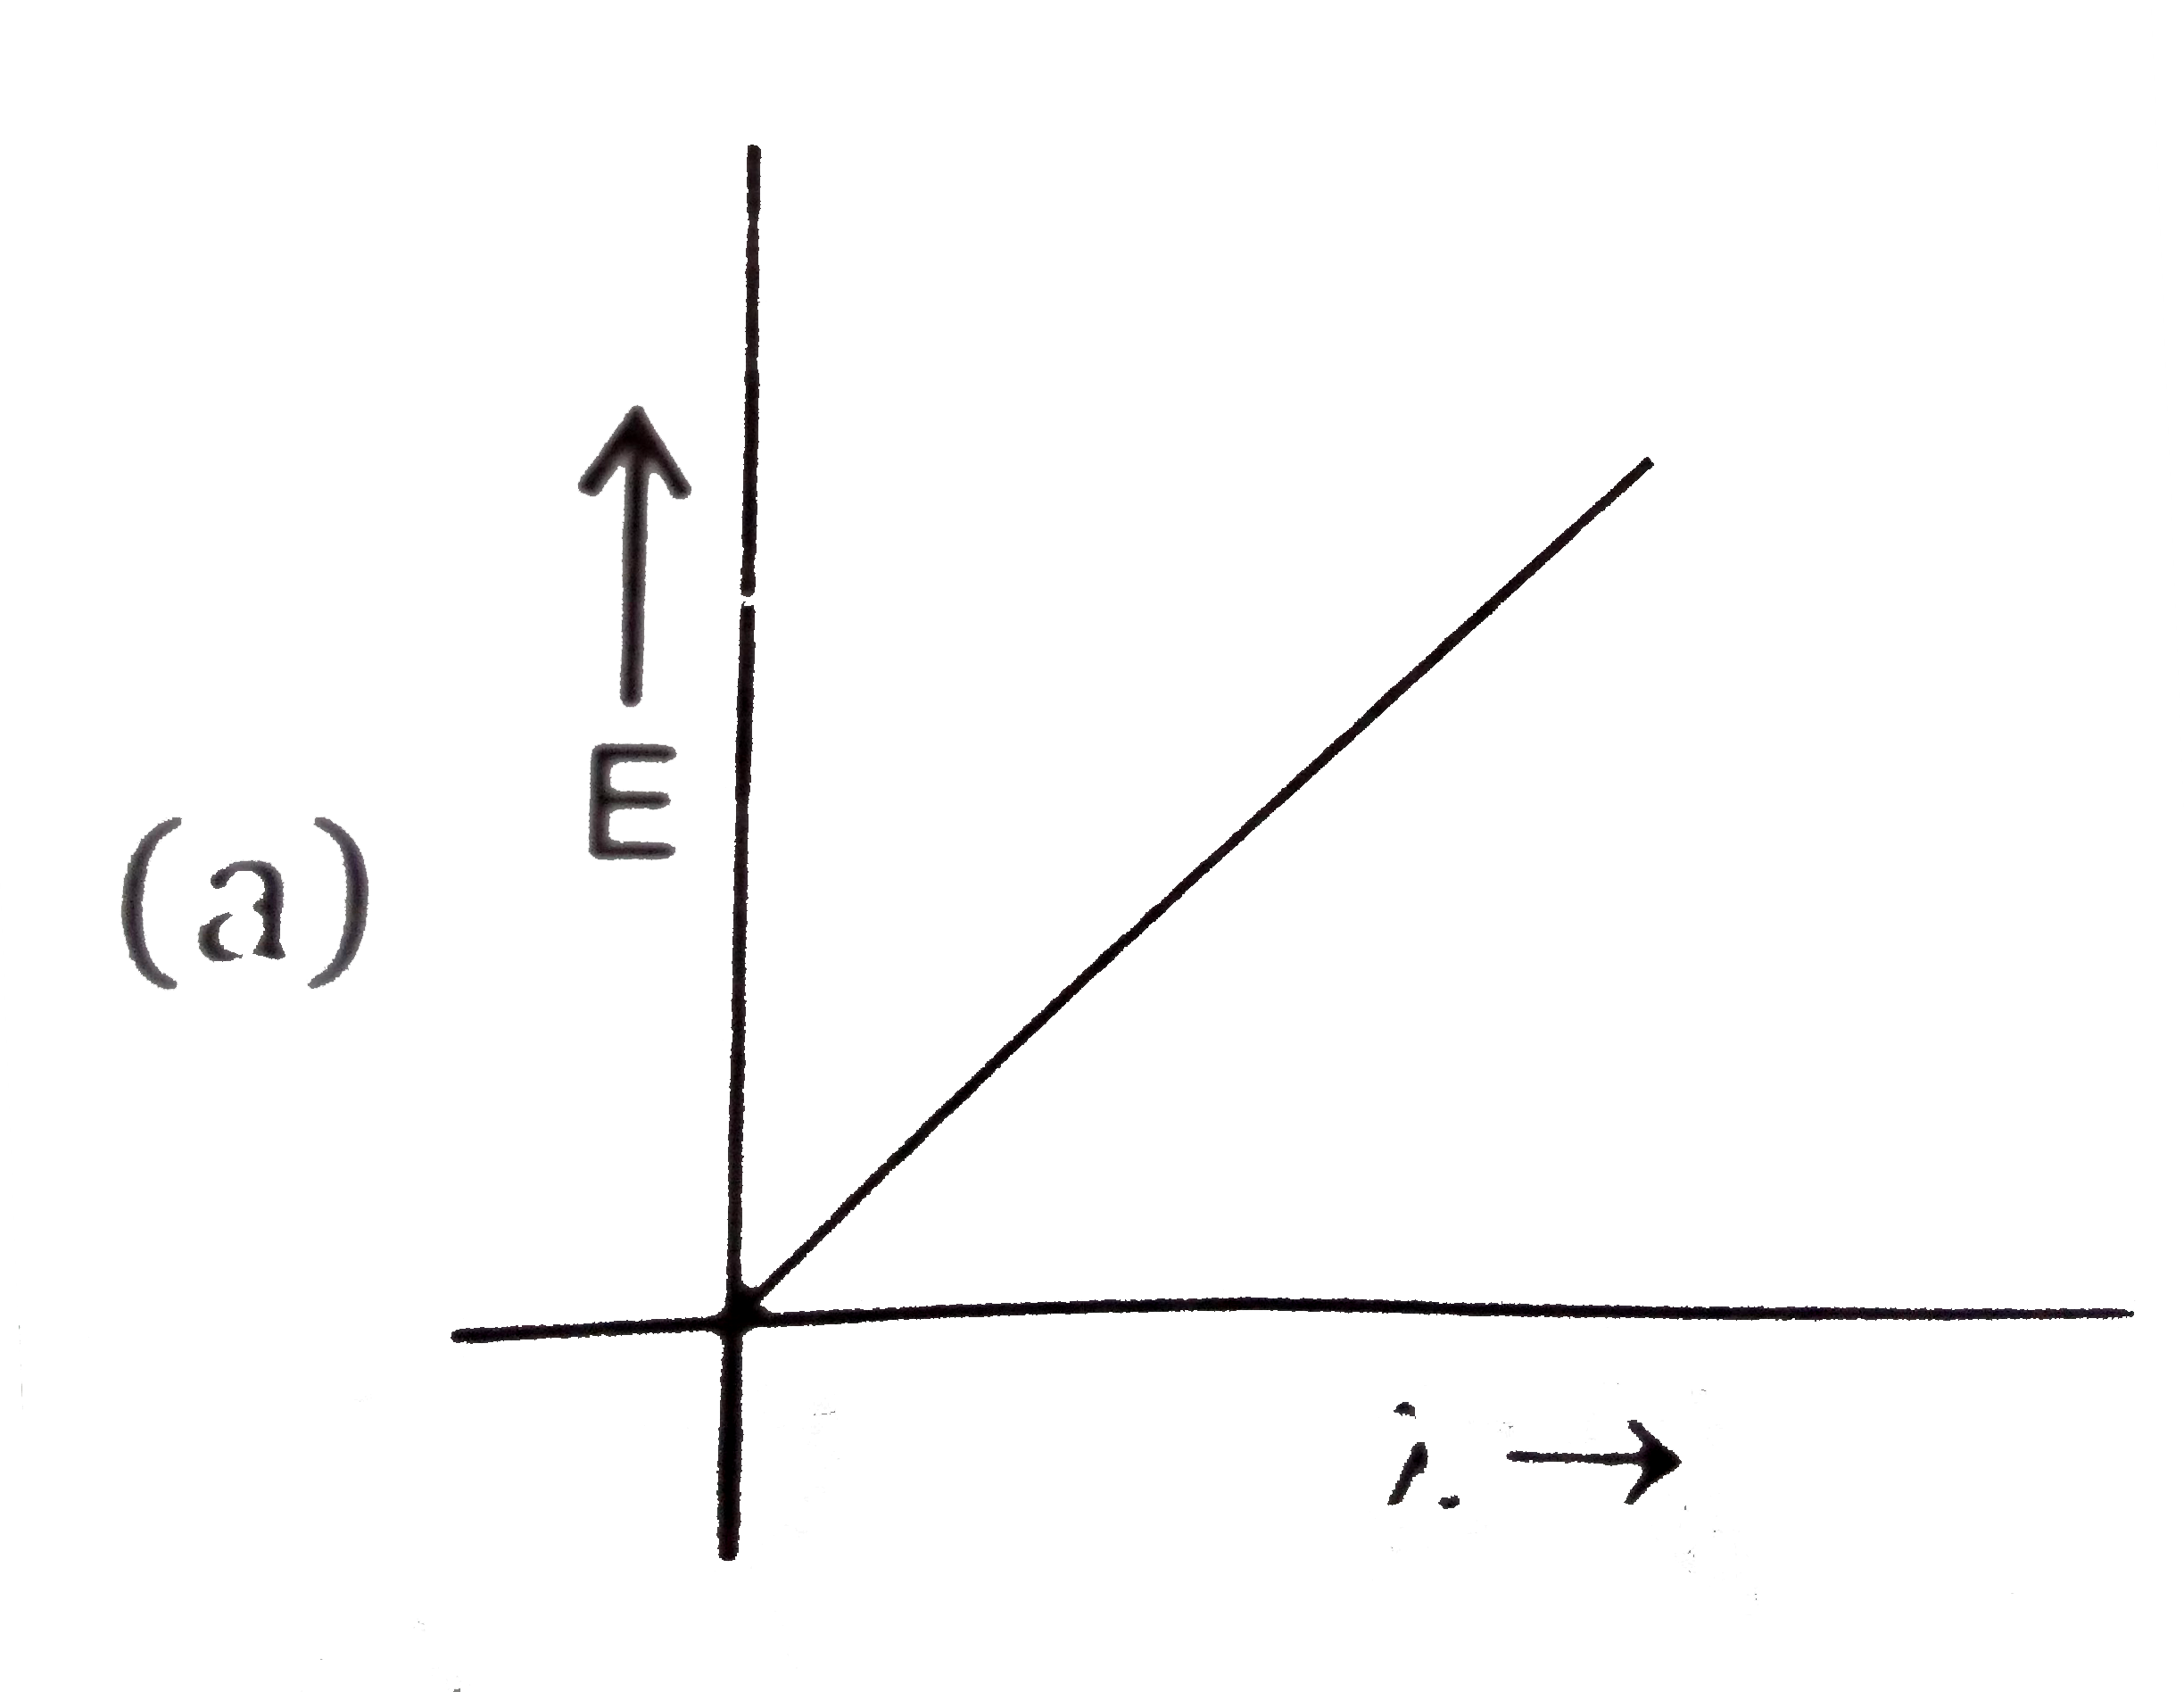
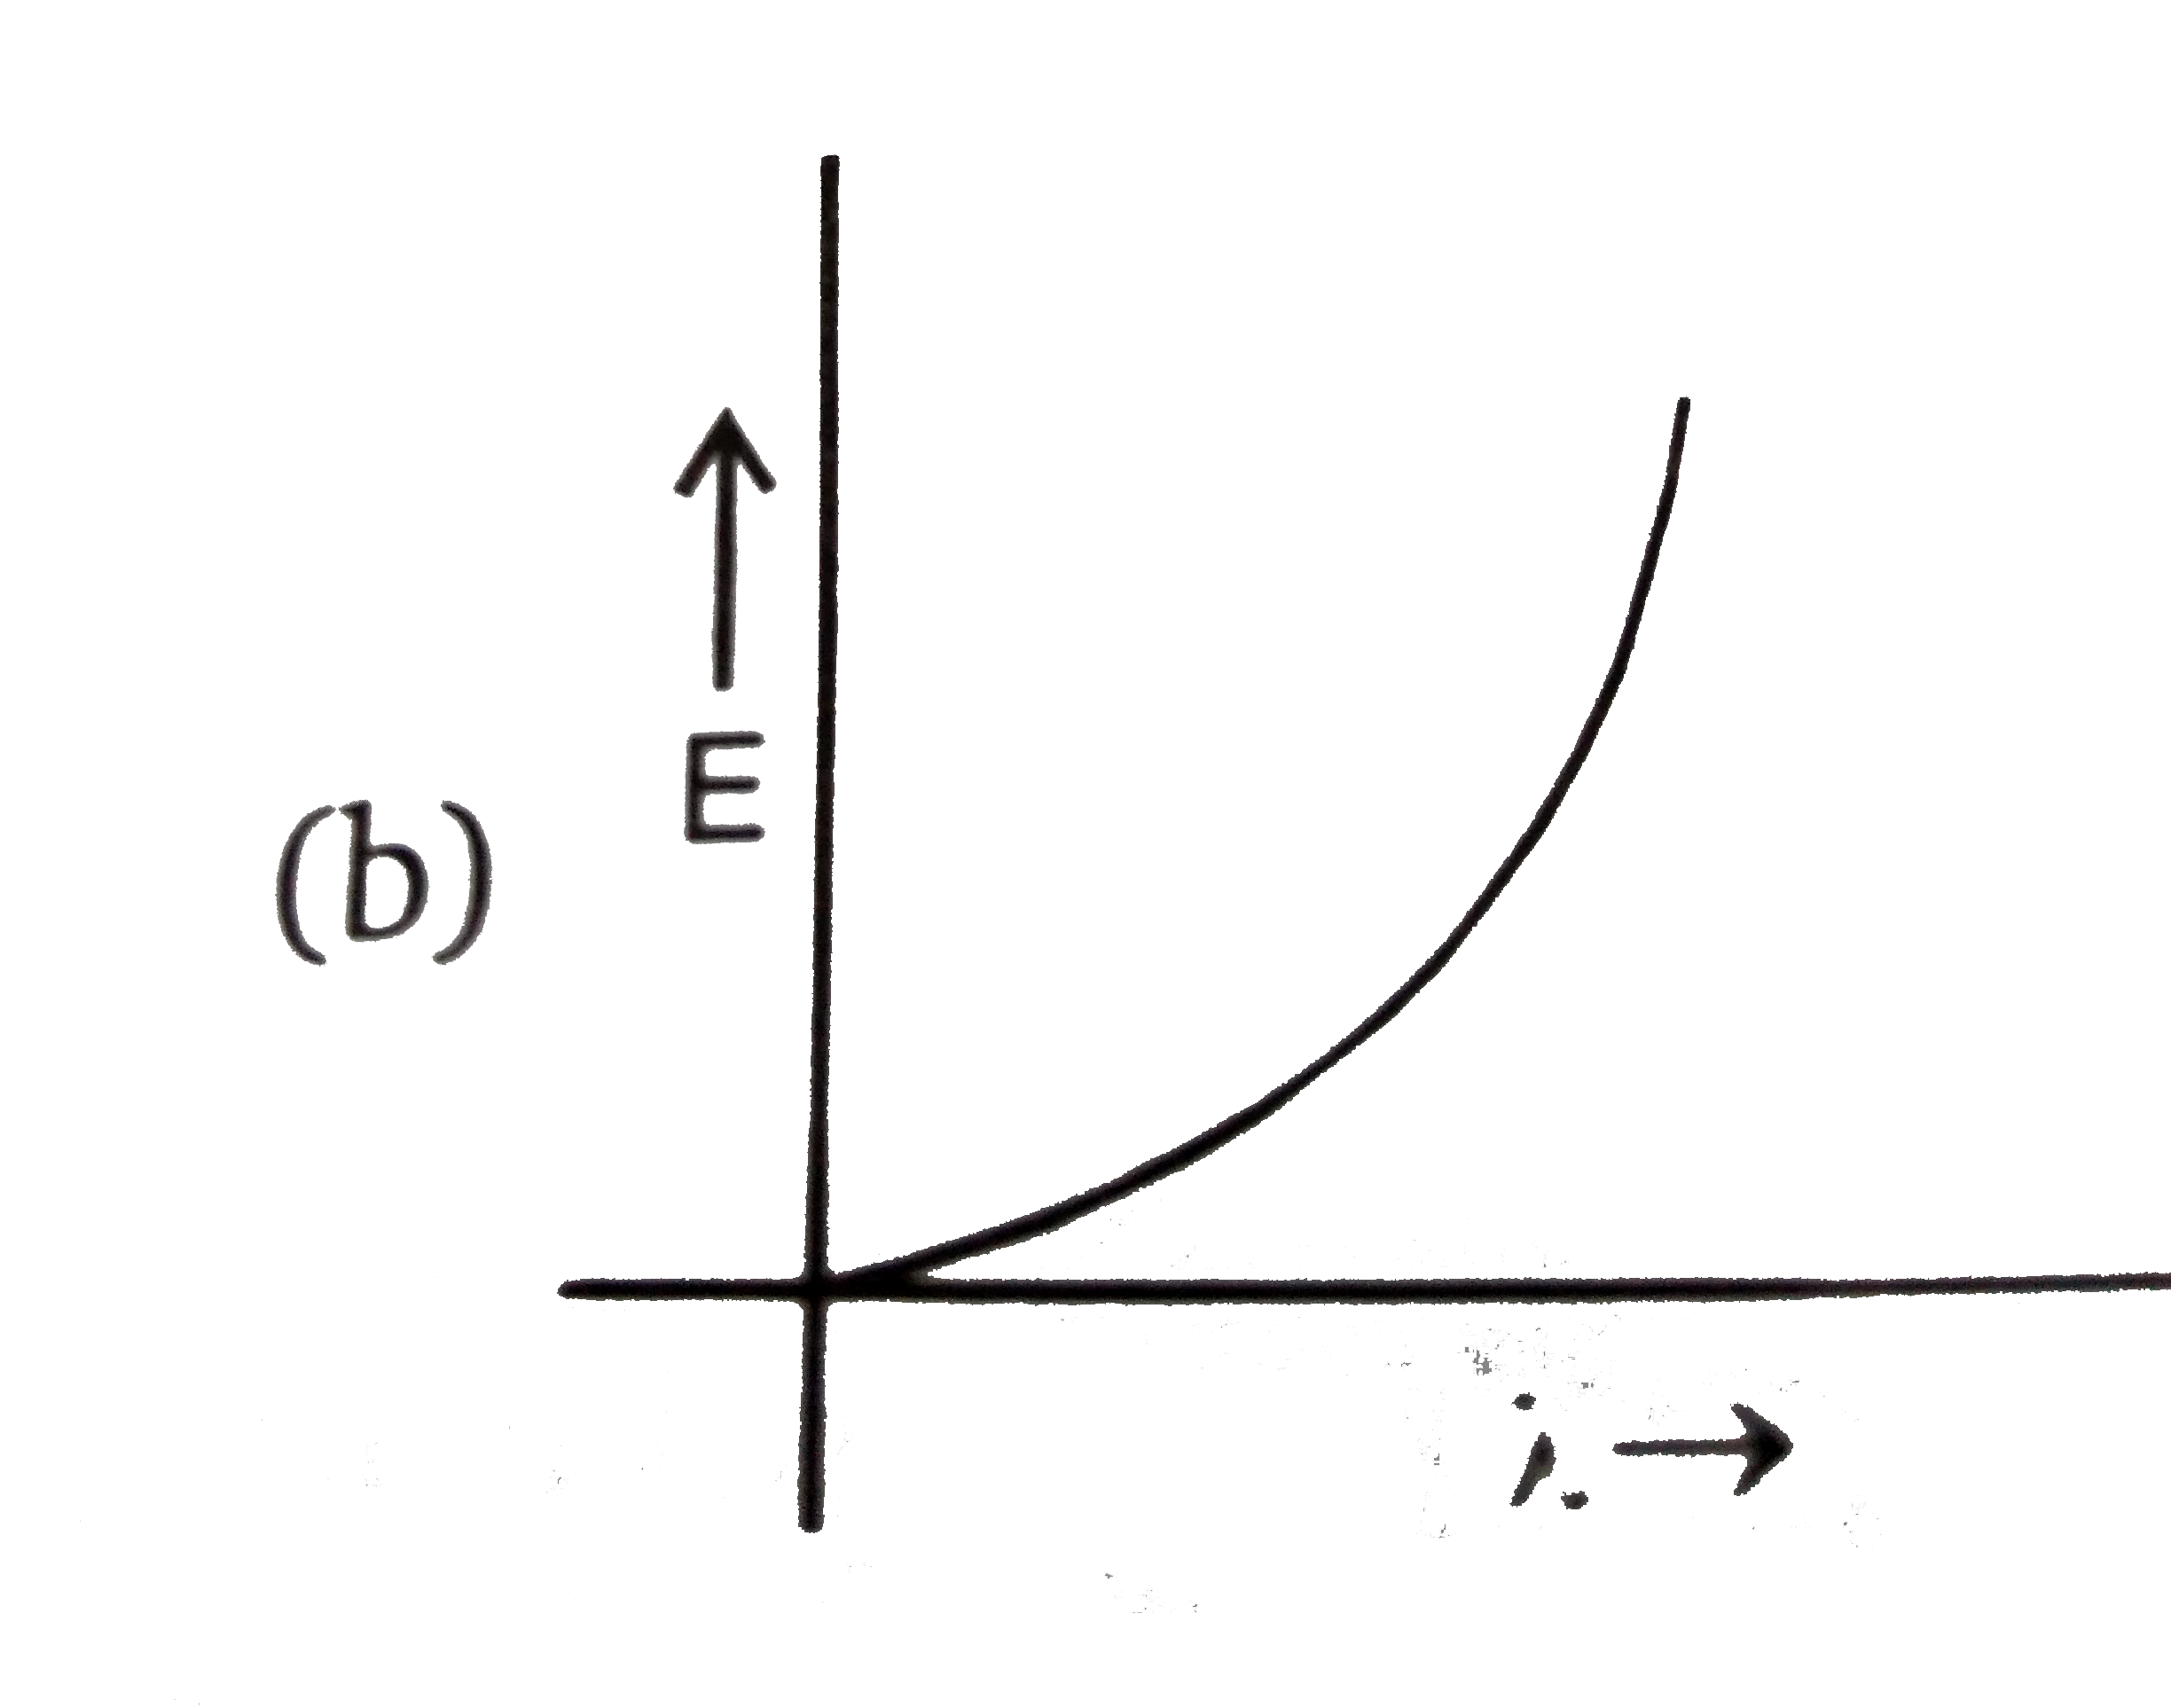
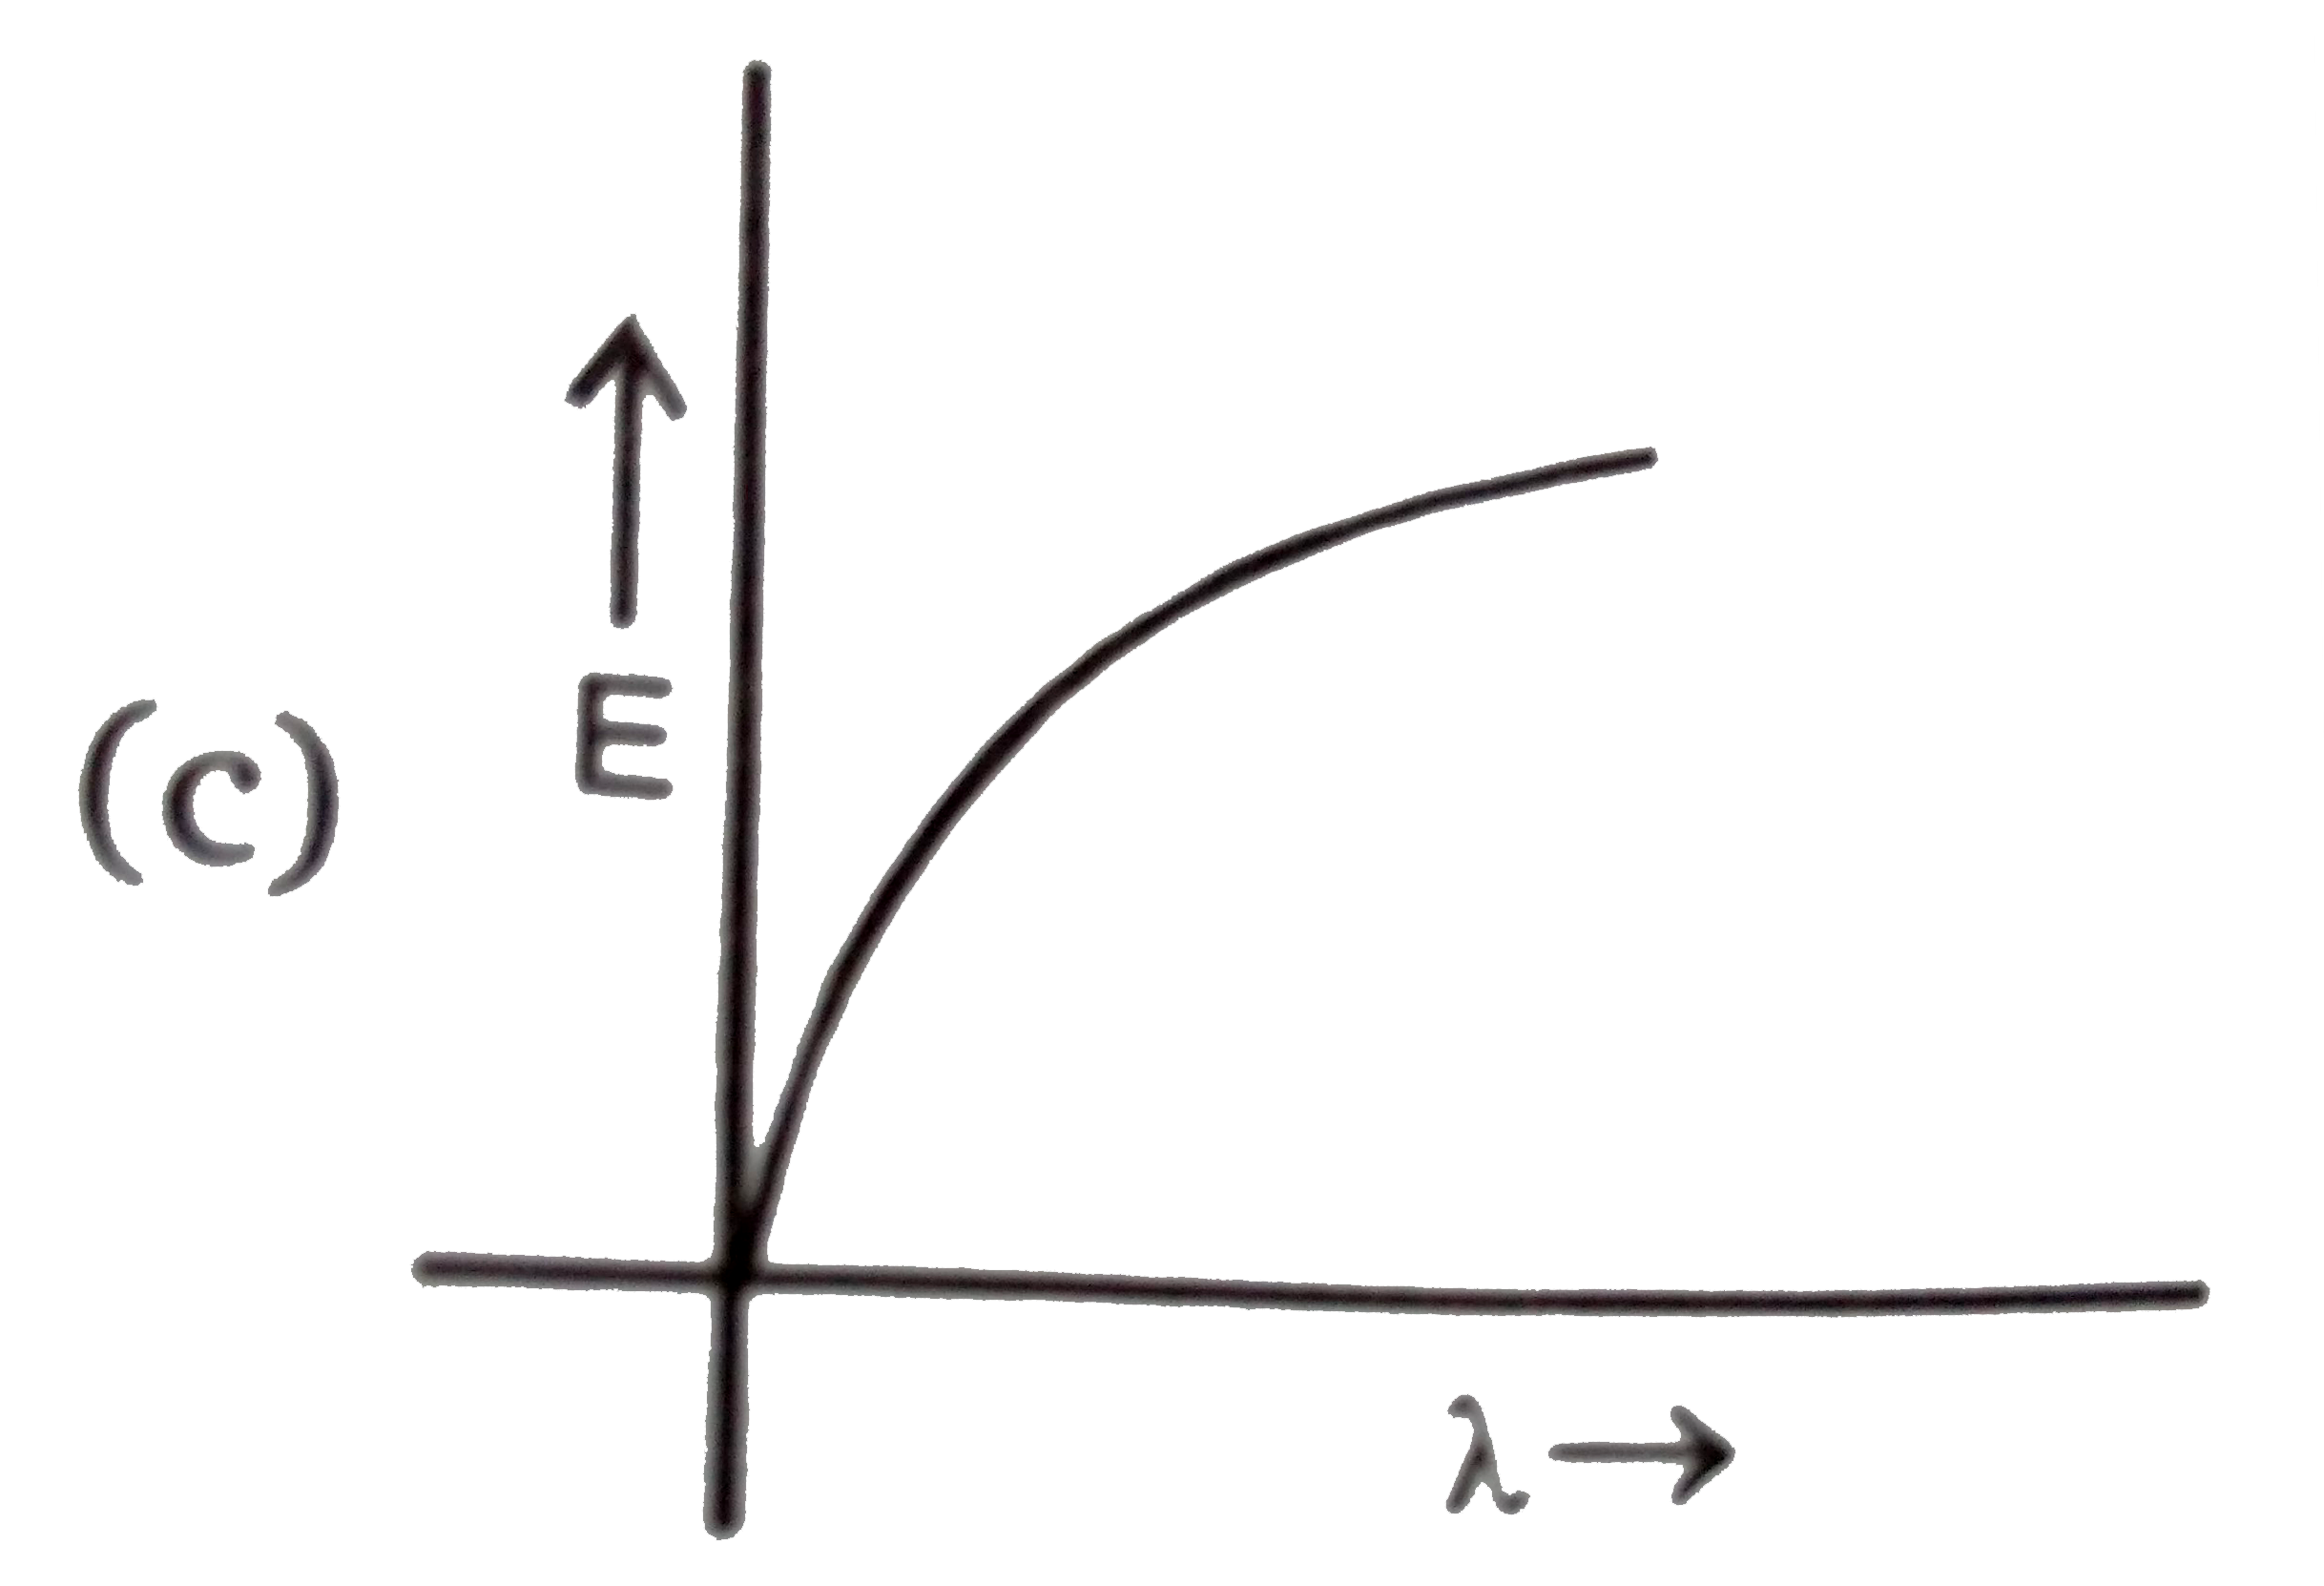
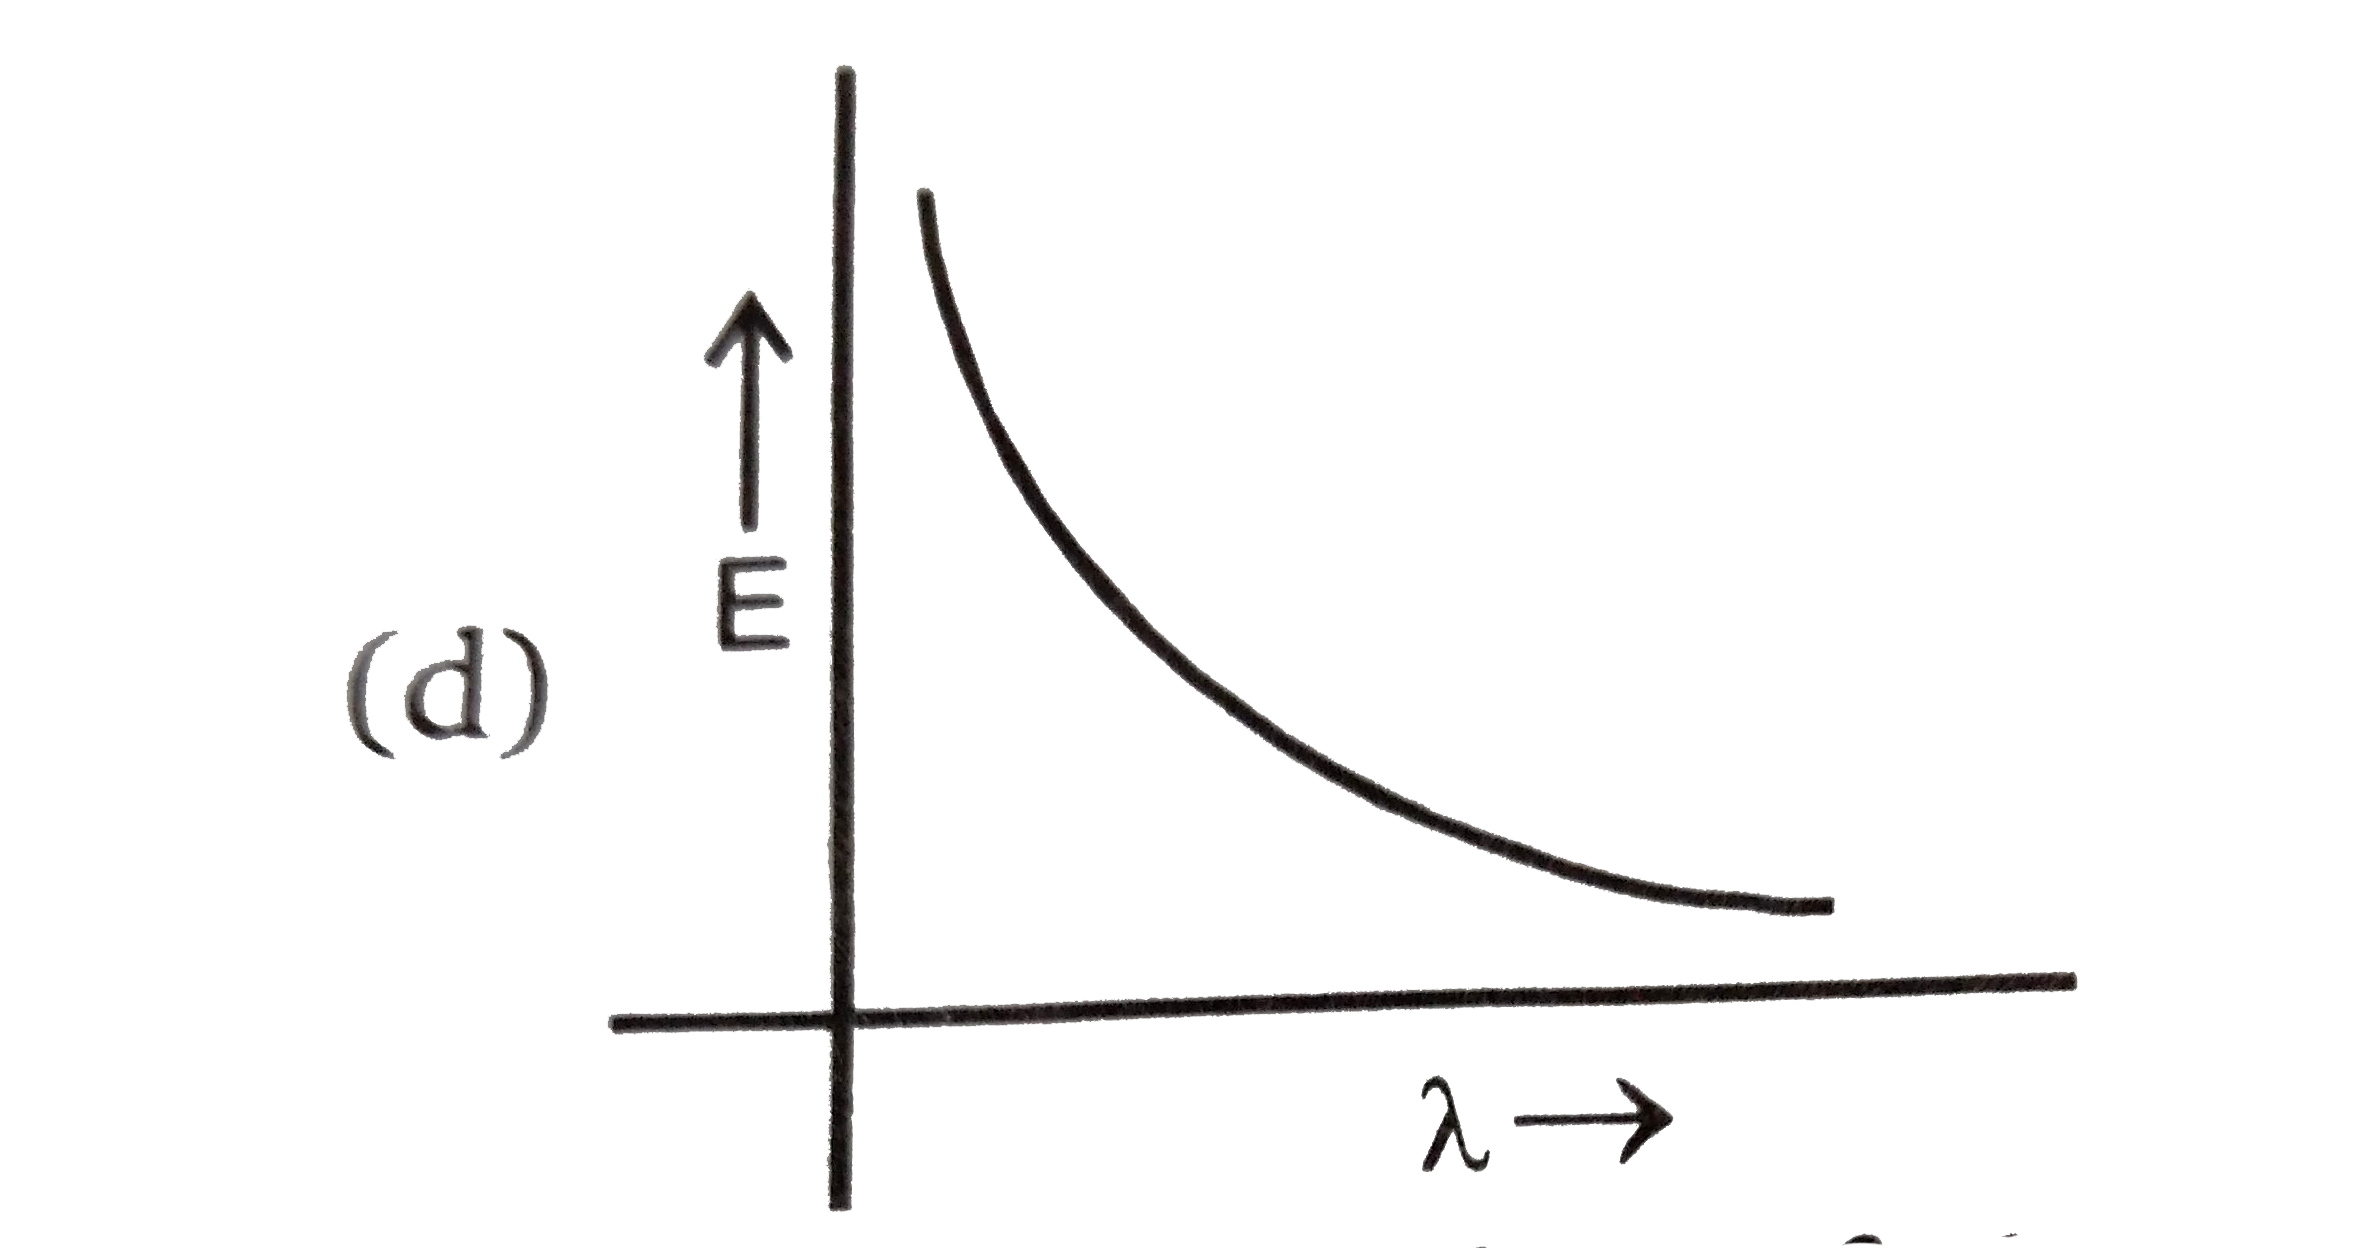
Which graph shows how the energy E of a photon of light is related to its wavelengths `(lamda)`?
A
B
C
D
Text Solution
AI Generated Solution
The correct Answer is:
To determine how the energy \( E \) of a photon of light is related to its wavelength \( \lambda \), we can follow these steps:
### Step-by-Step Solution:
1. **Understanding the Relationship**:
The energy \( E \) of a photon is given by the equation:
\[
E = h \nu
\]
where \( h \) is Planck's constant and \( \nu \) is the frequency of the light.
2. **Relating Frequency to Wavelength**:
The frequency \( \nu \) is related to the wavelength \( \lambda \) by the equation:
\[
c = \nu \lambda
\]
where \( c \) is the speed of light. Rearranging this gives:
\[
\nu = \frac{c}{\lambda}
\]
3. **Substituting Frequency into Energy Equation**:
Now, substituting the expression for frequency into the energy equation:
\[
E = h \left(\frac{c}{\lambda}\right)
\]
This simplifies to:
\[
E = \frac{hc}{\lambda}
\]
4. **Identifying the Relationship**:
From the equation \( E = \frac{hc}{\lambda} \), we can see that energy \( E \) is inversely proportional to wavelength \( \lambda \):
\[
E \propto \frac{1}{\lambda}
\]
5. **Graphical Representation**:
Since \( E \) is inversely proportional to \( \lambda \), the graph of \( E \) versus \( \lambda \) will be a hyperbola. This means that as the wavelength increases, the energy decreases, and vice versa.
6. **Choosing the Correct Graph**:
Among the given options, the graph that represents an inverse relationship (hyperbola) is the correct one. The other options (parabola, linear, etc.) do not represent this relationship.
### Conclusion:
The correct graph that shows how the energy \( E \) of a photon of light is related to its wavelength \( \lambda \) is a hyperbolic graph.
---