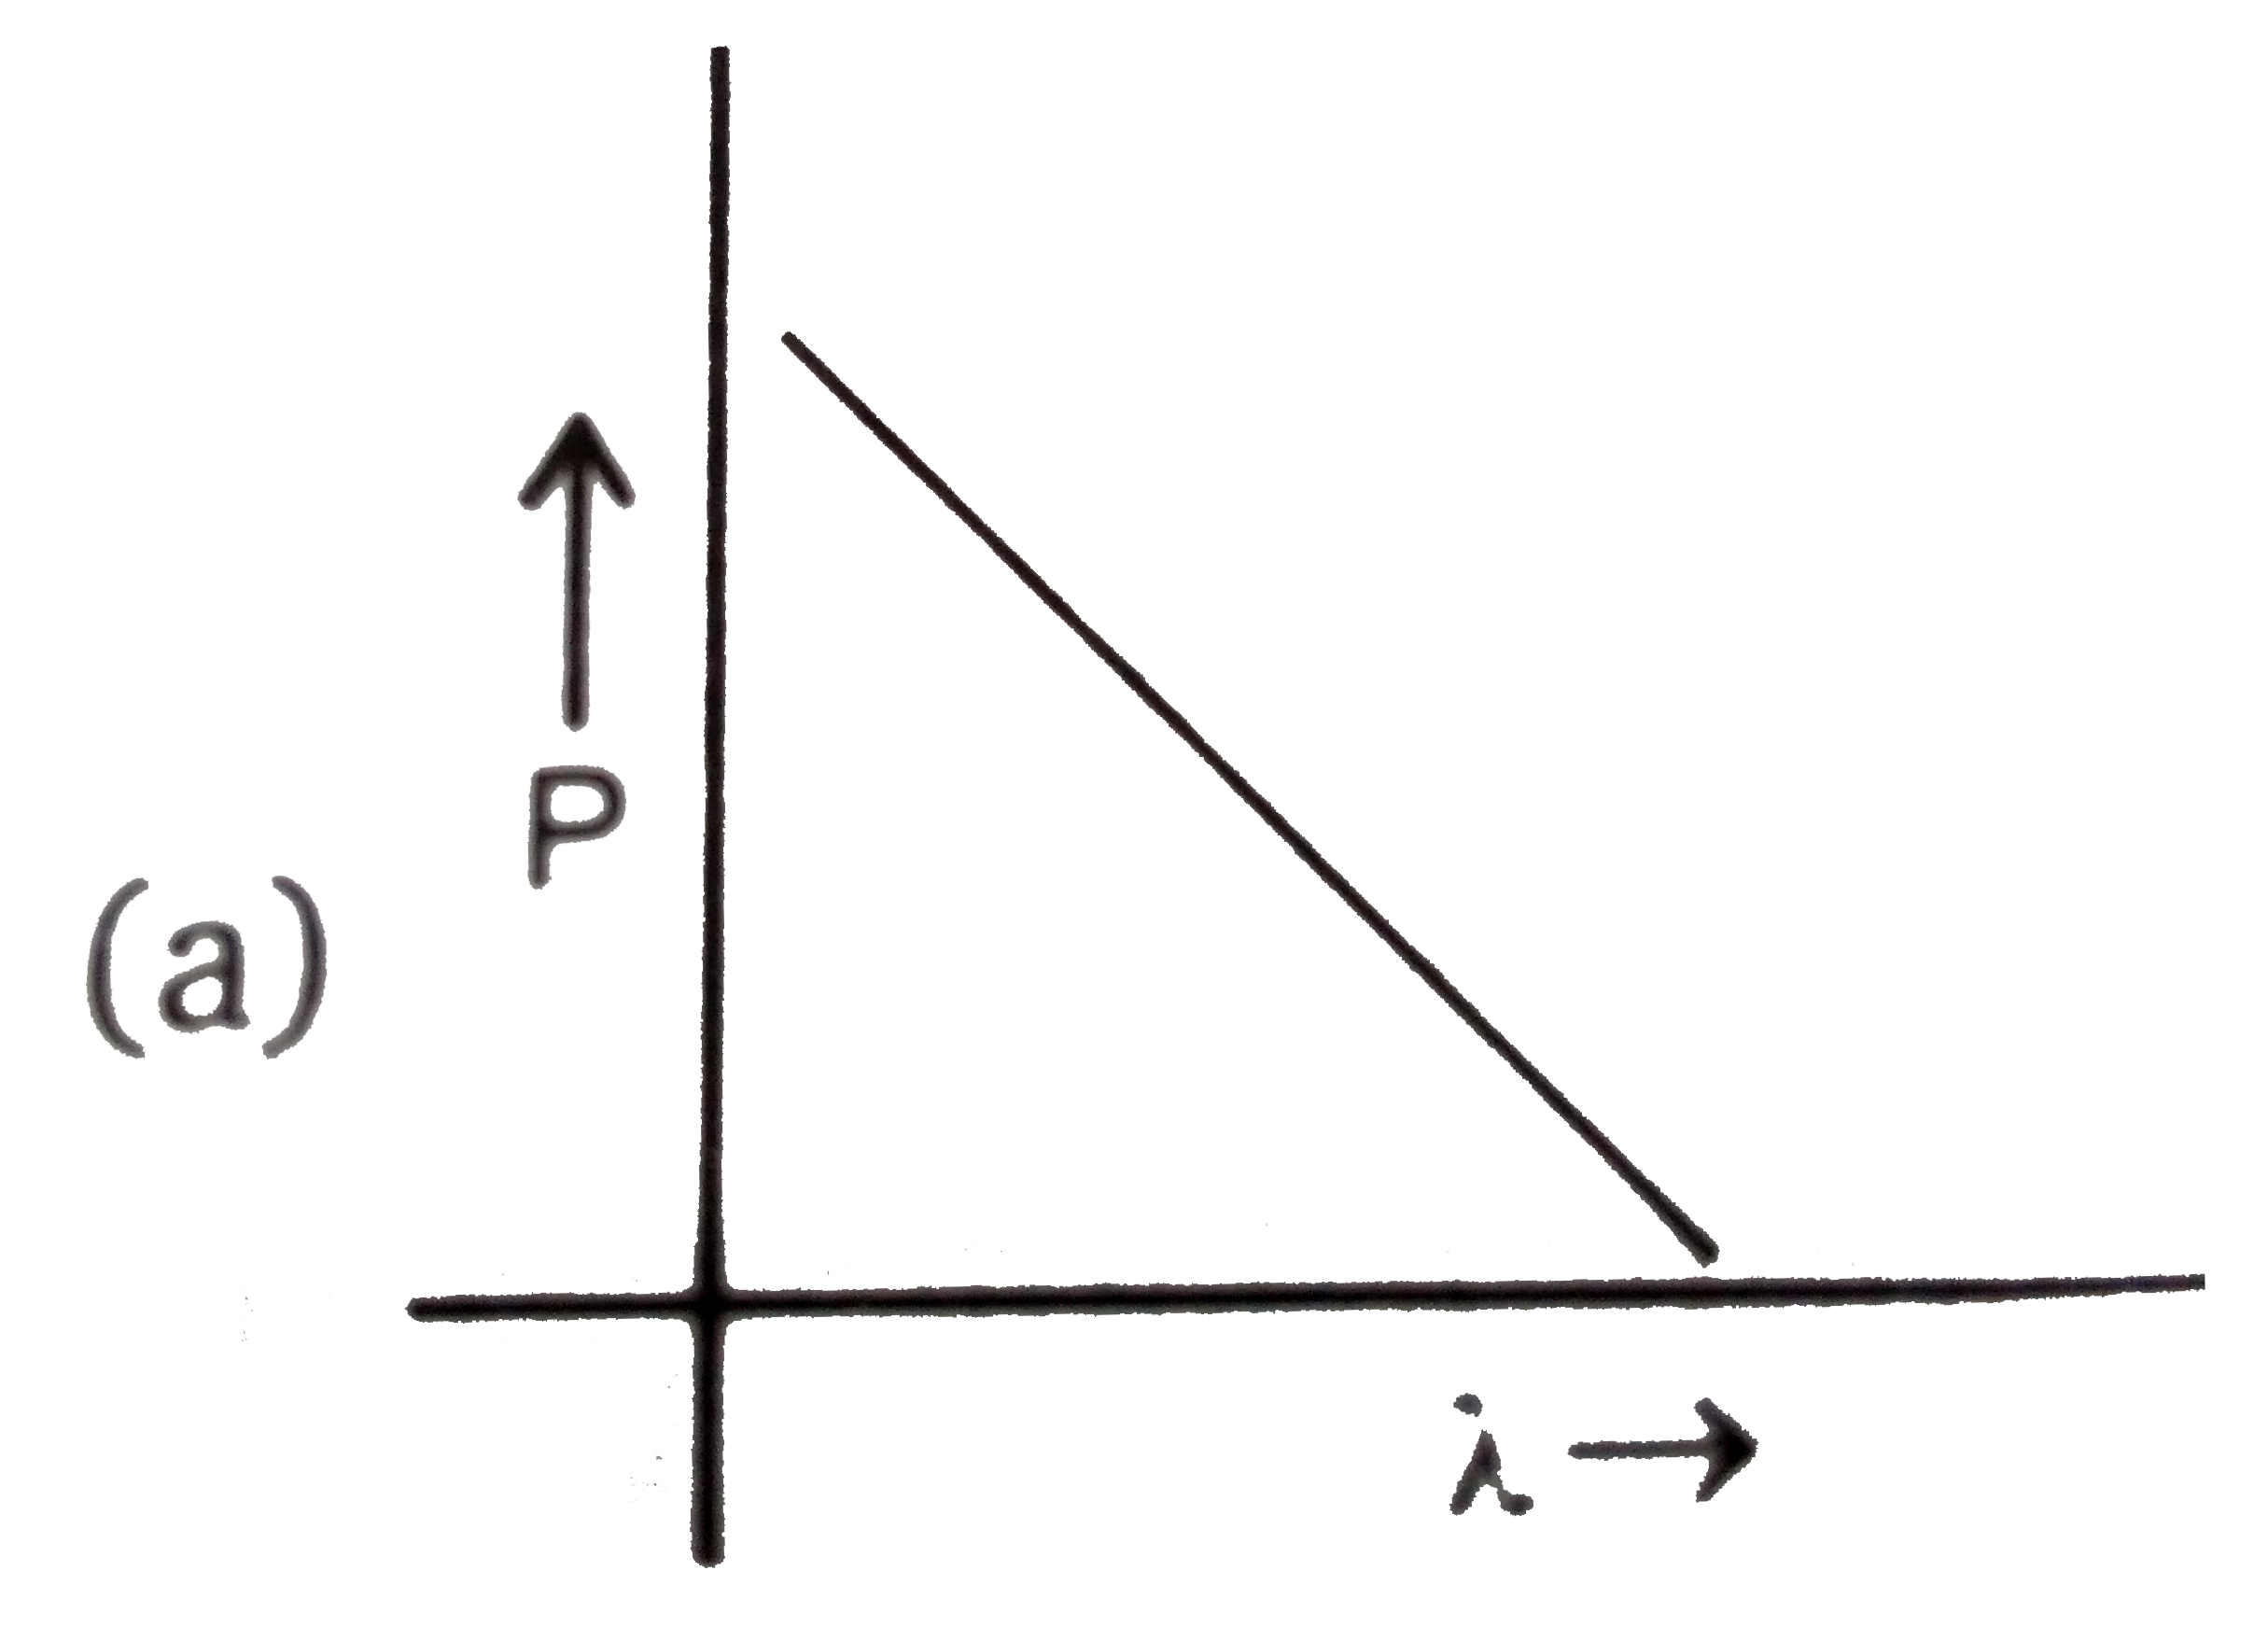
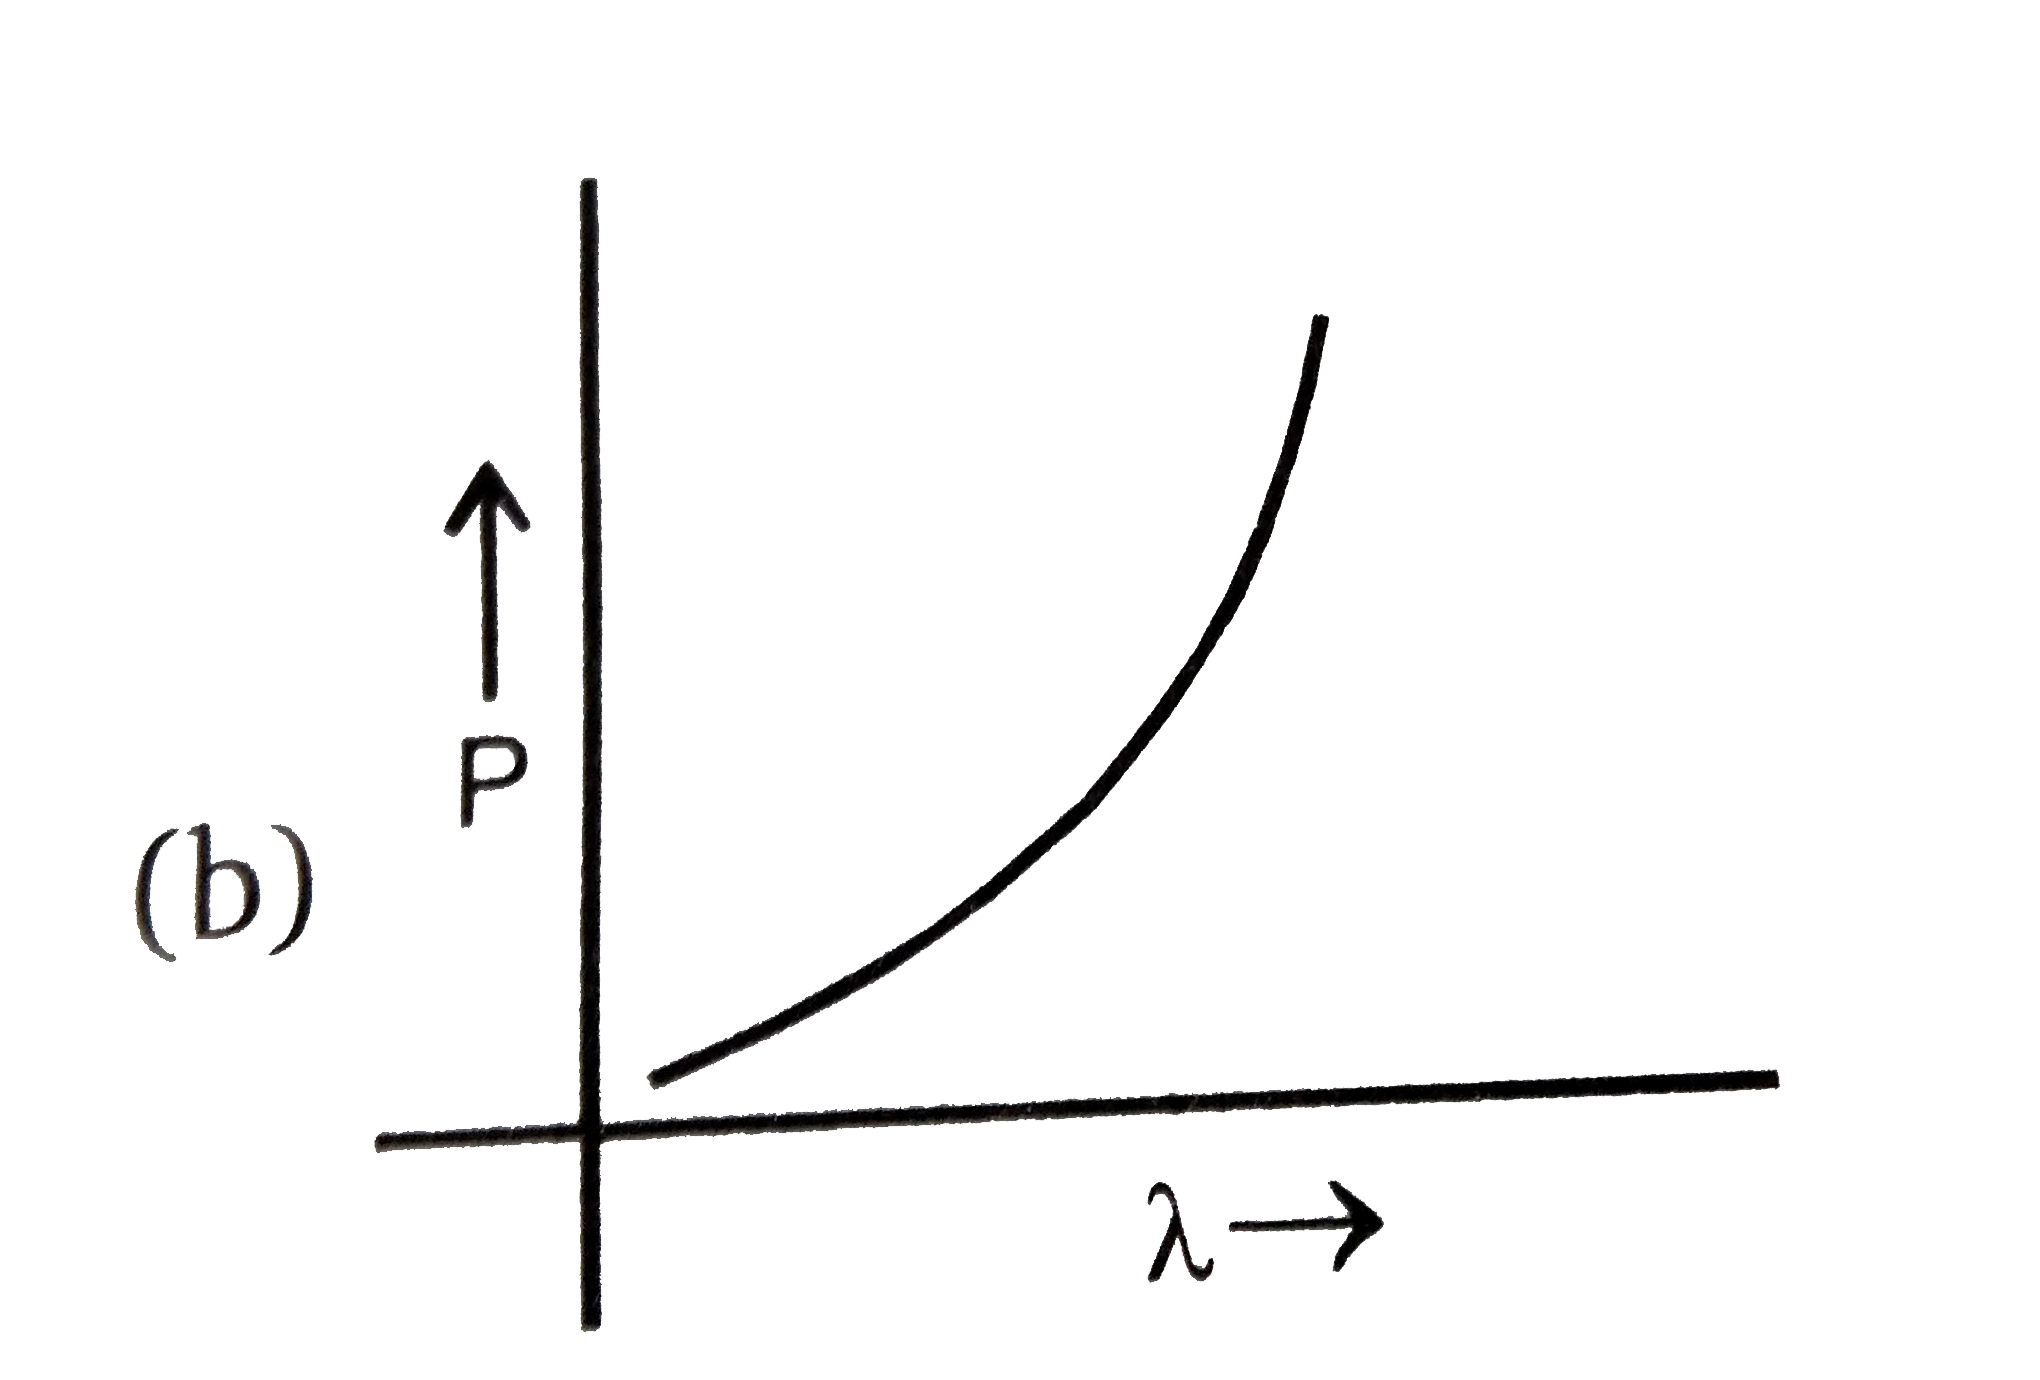
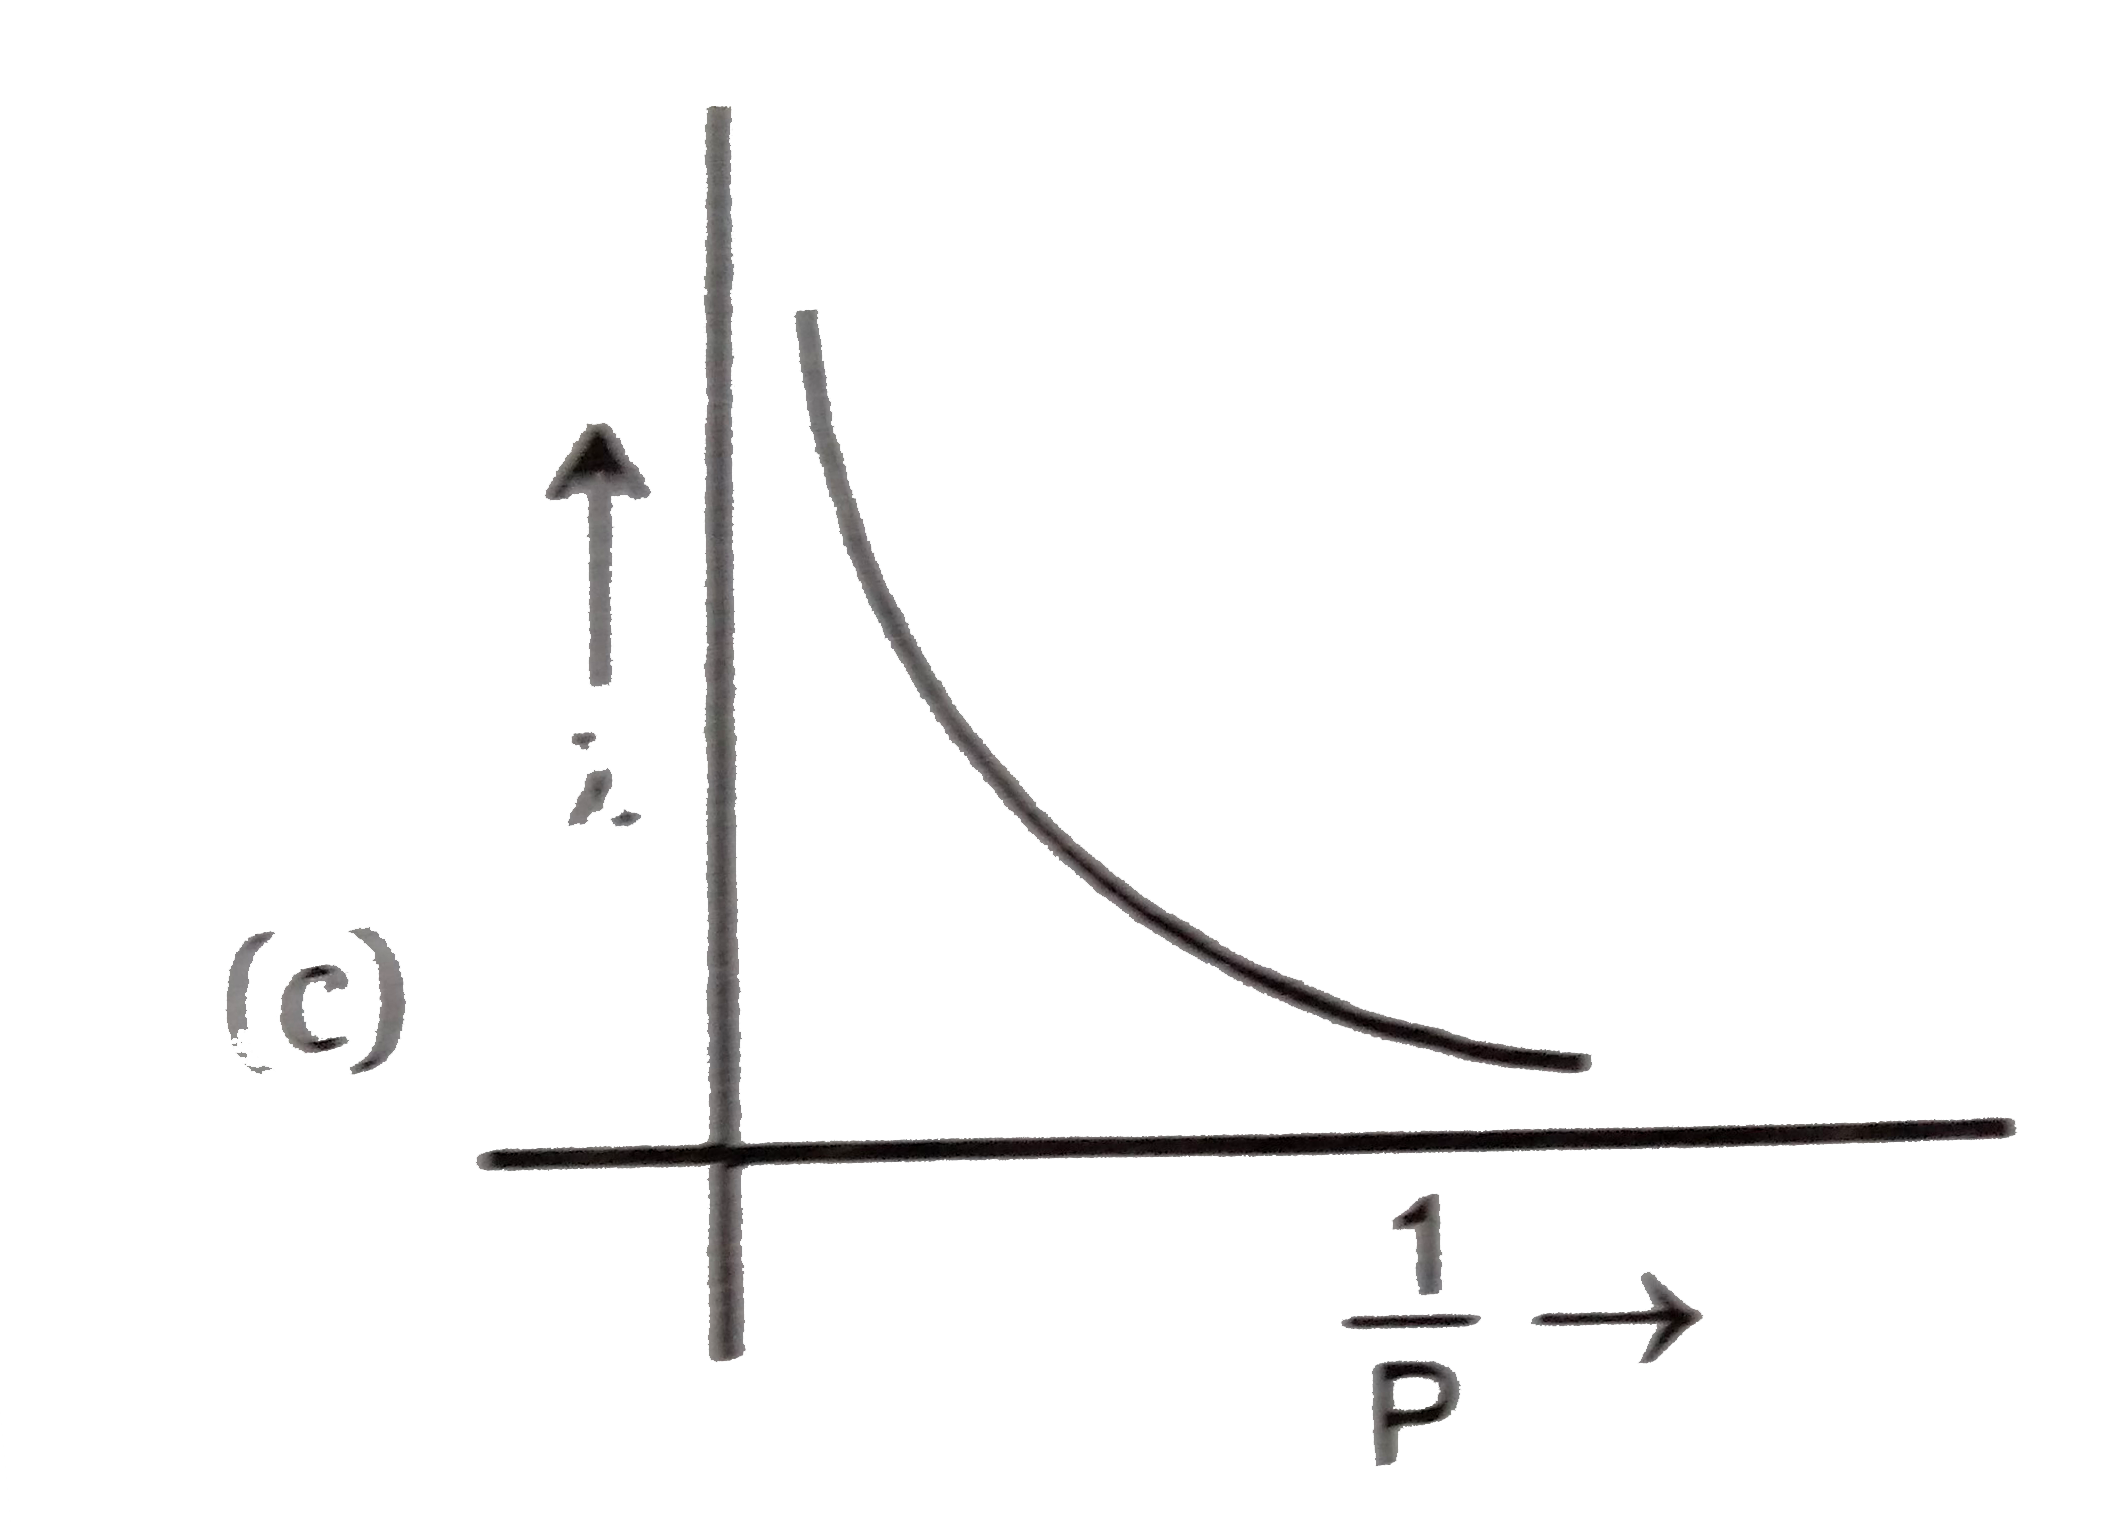
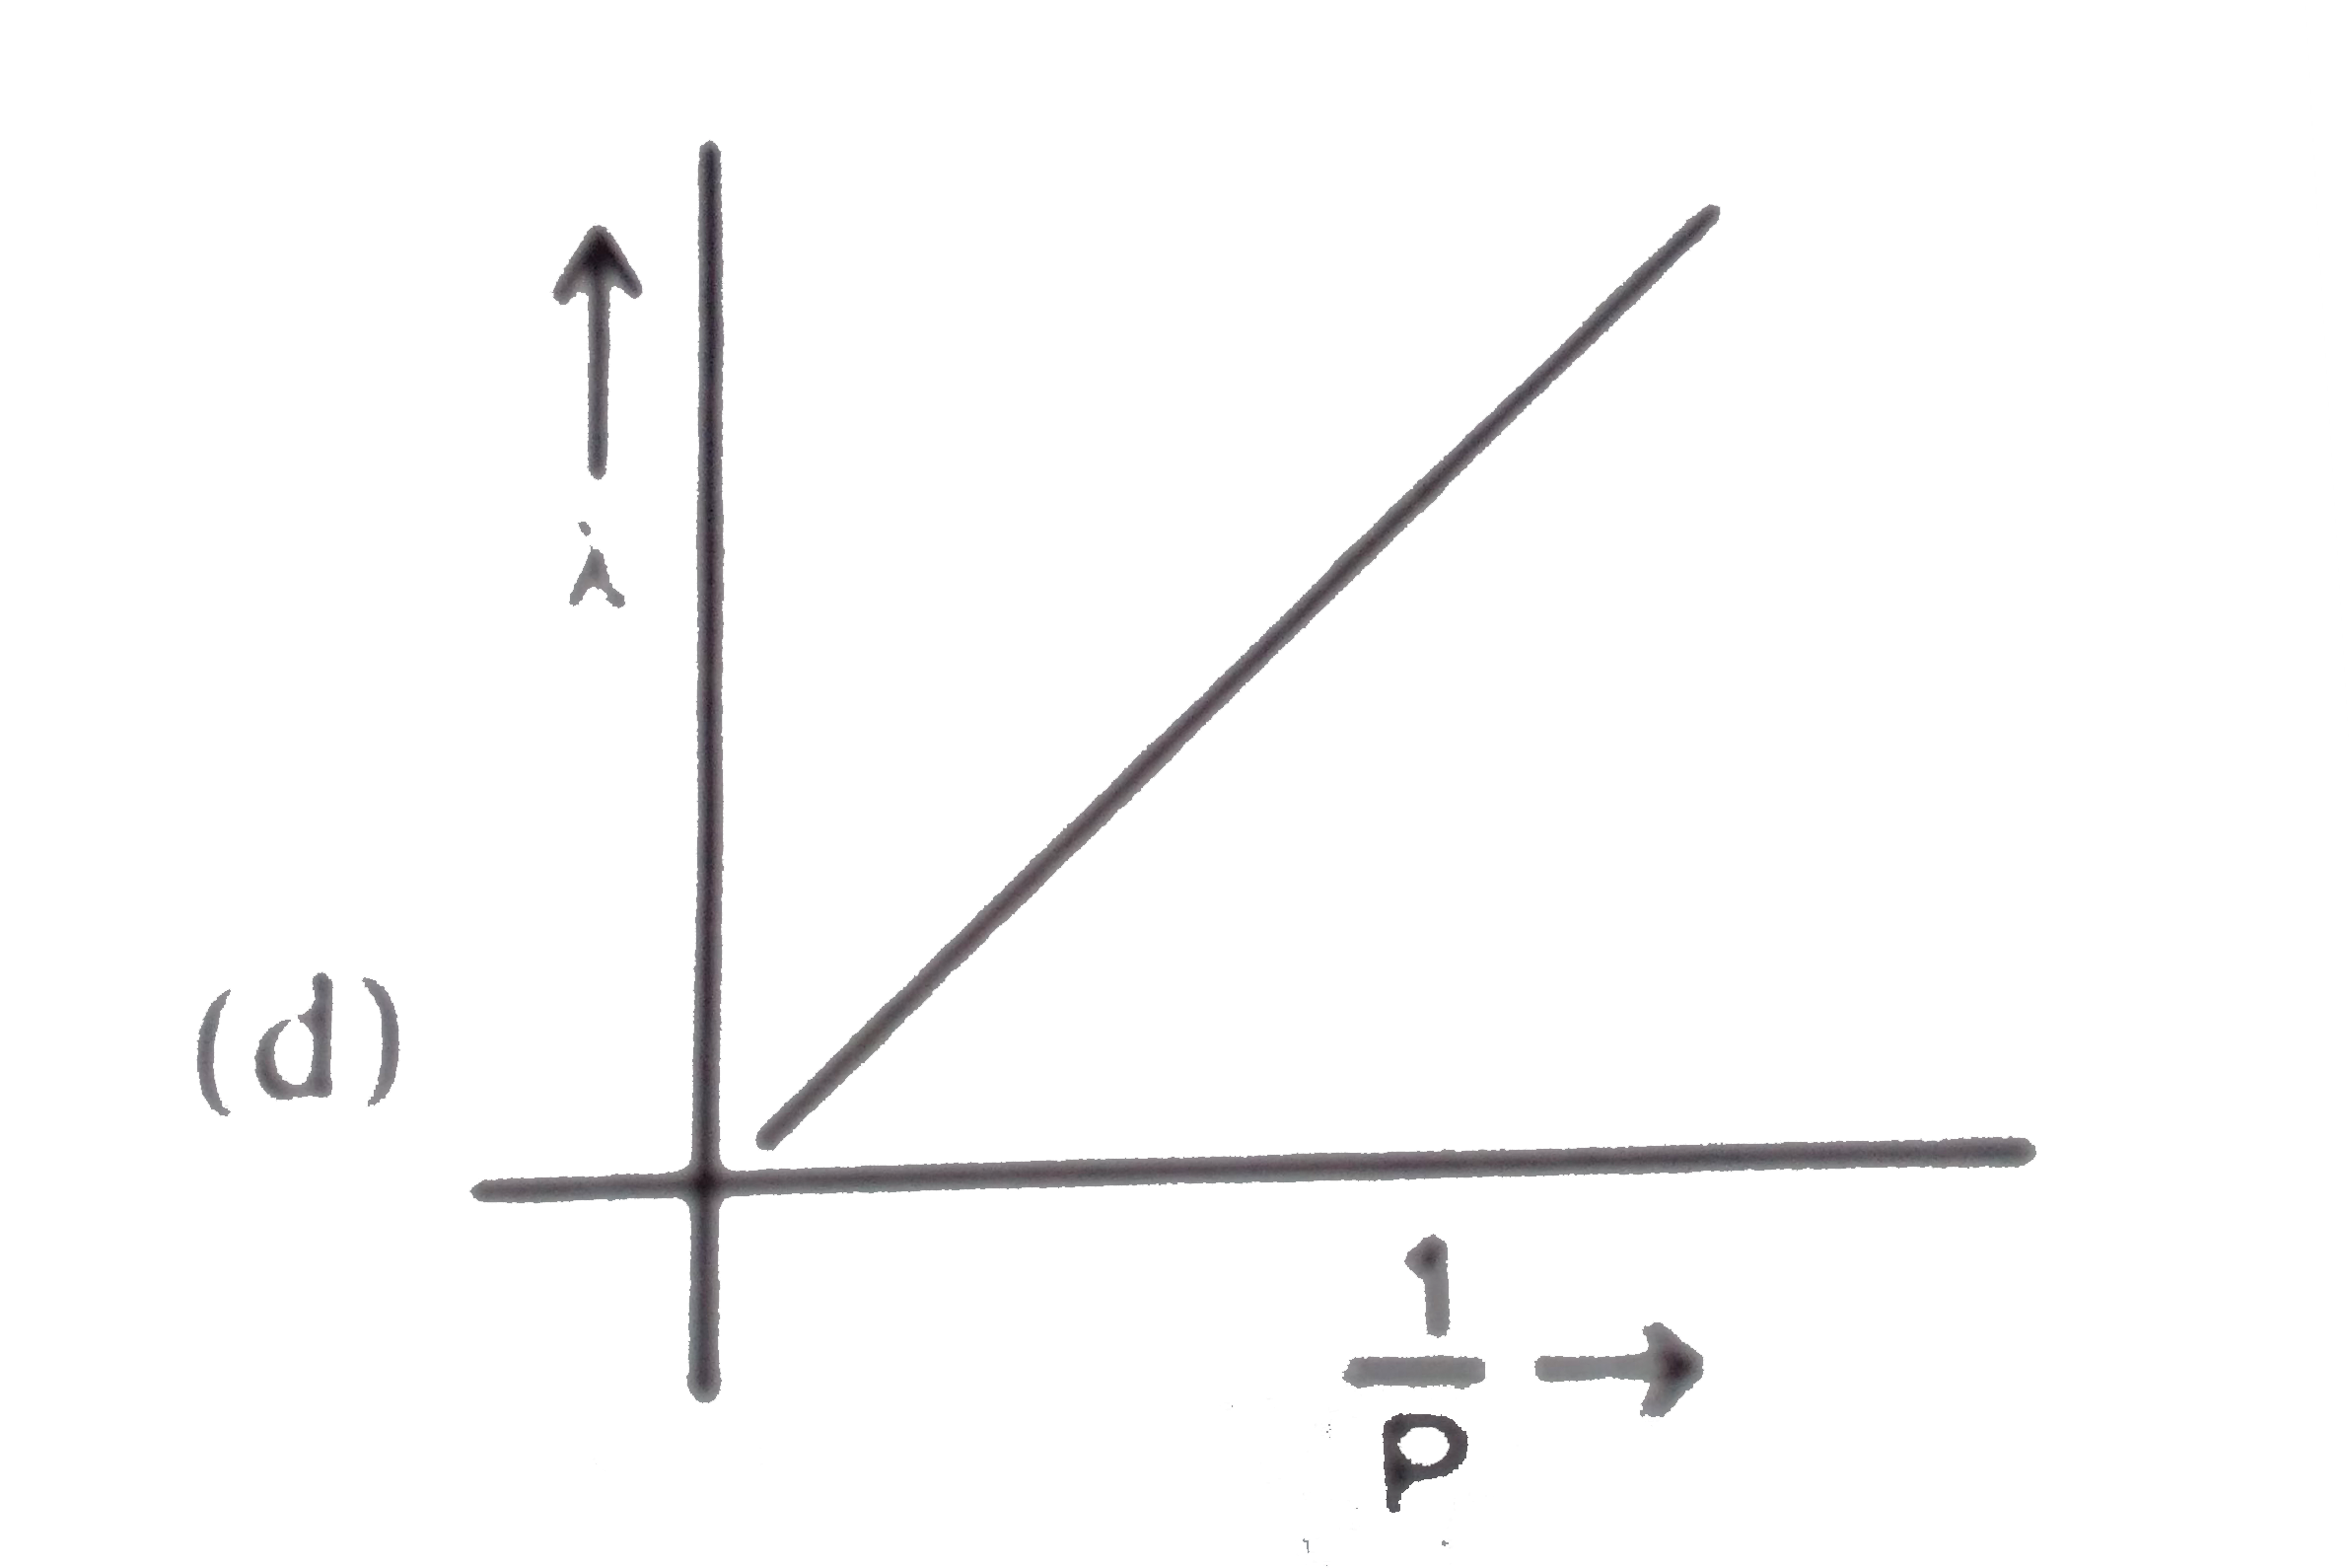
Which of following graphs correctly represents the variation of particle momentum with de-Broglie wavelength?
A
B
C
D
Text Solution
AI Generated Solution
The correct Answer is:
To solve the question regarding the variation of particle momentum with de-Broglie wavelength, we can follow these steps:
### Step-by-Step Solution:
1. **Understand the de-Broglie Hypothesis**:
- According to de-Broglie's hypothesis, every particle has a wave-like nature. The wavelength (λ) associated with a particle is given by the formula:
\[
\lambda = \frac{h}{p}
\]
where \( h \) is Planck's constant and \( p \) is the momentum of the particle.
2. **Rearranging the Equation**:
- From the de-Broglie equation, we can express momentum \( p \) in terms of wavelength \( \lambda \):
\[
p = \frac{h}{\lambda}
\]
- This shows that momentum is inversely proportional to the wavelength.
3. **Graphical Representation**:
- Since \( p \) is inversely proportional to \( \lambda \), we can conclude that as the wavelength increases, the momentum decreases. This relationship is characteristic of a hyperbolic graph.
- If we plot momentum \( p \) on the y-axis and wavelength \( \lambda \) on the x-axis, the graph will be a hyperbola that approaches the axes but never touches them.
4. **Analyzing the Options**:
- **Option A**: Graph showing a direct relationship (incorrect, as it should be hyperbolic).
- **Option B**: Another incorrect representation, likely showing a different incorrect relationship.
- **Option C**: This option may represent the relationship between \( \lambda \) and \( \frac{1}{p} \), which would be a straight line (but not what we need).
- **Option D**: This option should correctly represent the inverse relationship between \( p \) and \( \lambda \) as a hyperbola.
5. **Conclusion**:
- The correct graph that represents the variation of particle momentum with de-Broglie wavelength is the one that depicts an inverse relationship, which is a hyperbola.
### Final Answer:
The correct graph is the one that shows the inverse relationship between momentum \( p \) and de-Broglie wavelength \( \lambda \), which is a hyperbola.
---
NARENDRA AWASTHI ENGLISH|Exercise Match the column|1 Videos
Similar Questions
Explore conceptually related problems
Which of the following graphs correctly represents the variation of g on the - Earth?
The velocity -displacement graph of a particle is as shown in the figure. Which of the following graphs correctly represents the variation of acceleration with displacement?
Which of the following figure represents the variation of particle momentum and the associated de - Broglie wavelength ?
Which of the following graph correctly represents the variation of molar conductance (Delta_m) with dilution for a strong electrolyte ?
Within elastic limit, which of the following graphs correctly represents the variation of extension in the length of wire with the external load?
Which of the following graphs best represents the variation of acceleration 'a' with displacement x?
Which of the following graphs correctly represents the variation of beta=-(dV//dP)/V with P for an ideal gas at constant temperature?
Which of the following graphs correctly represents the variation of beta=-(dV//dP)/V with P for an ideal gas at constant temperature?
Which of the following graphs correctly represents the variation of beta= -((dV)/(dP))//V with P for an ideal gas at constant temperature
The given graph shows the variation of velocity with displacement. Which one of the graphs given below correctly represents the variation of acceleration with displacement ?