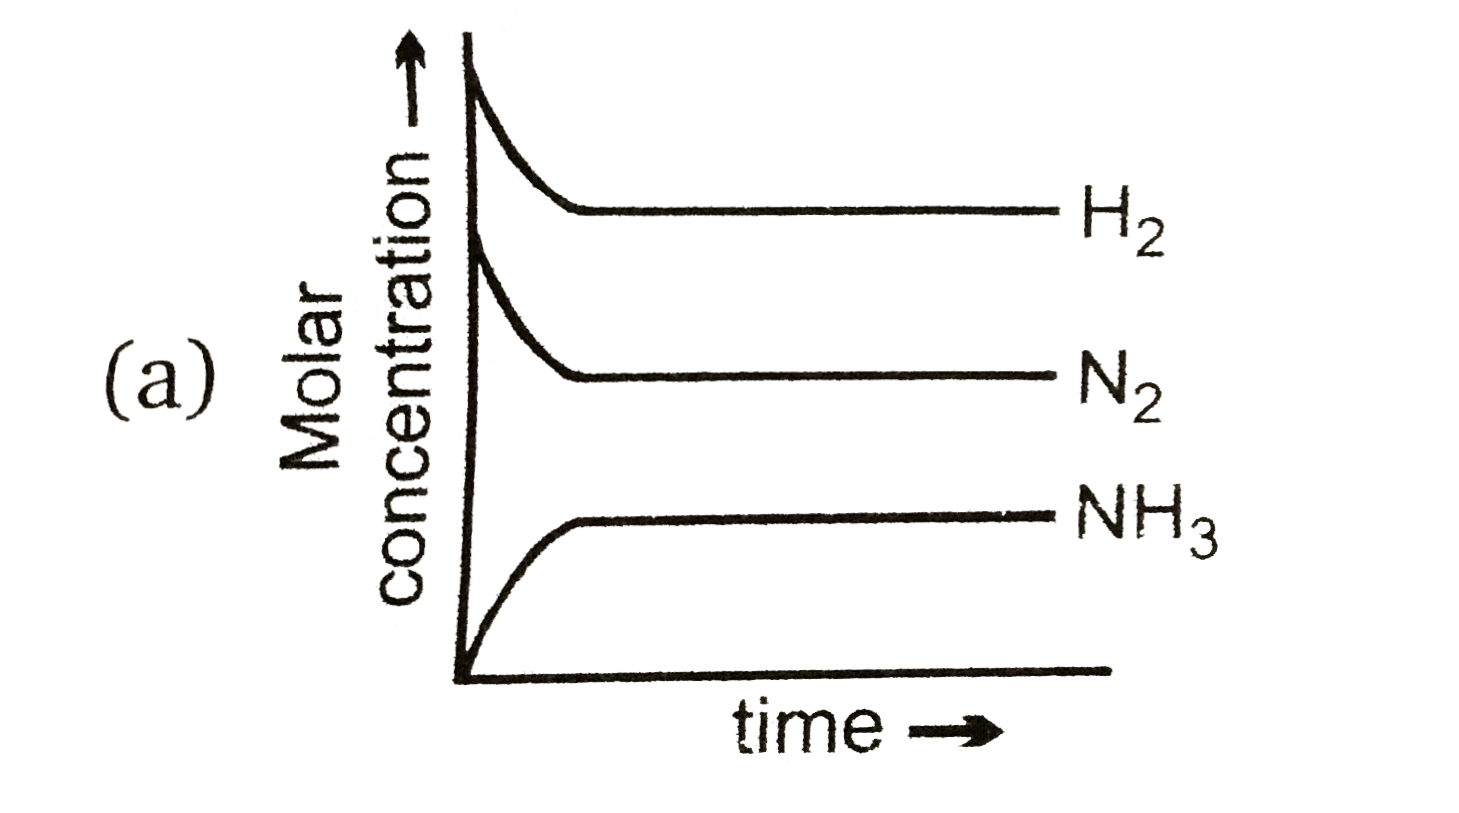
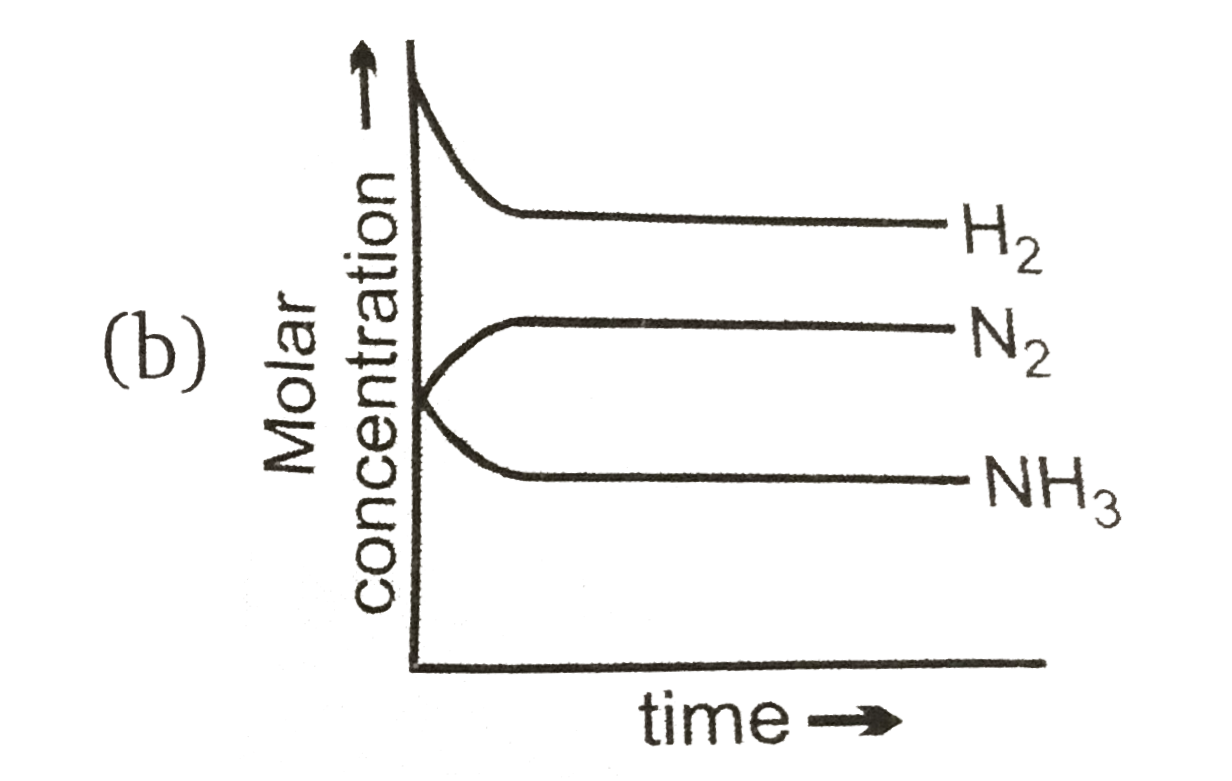
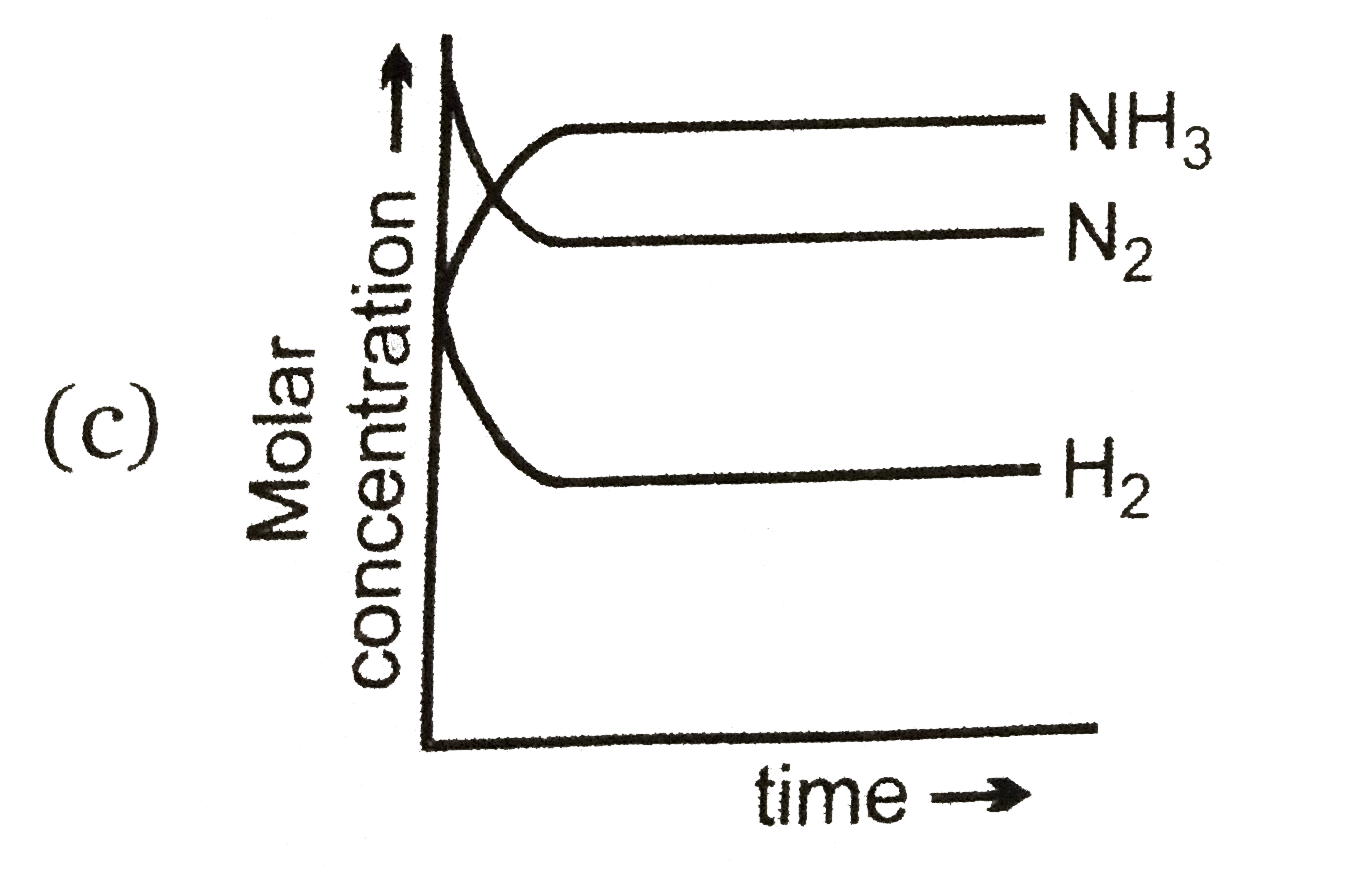
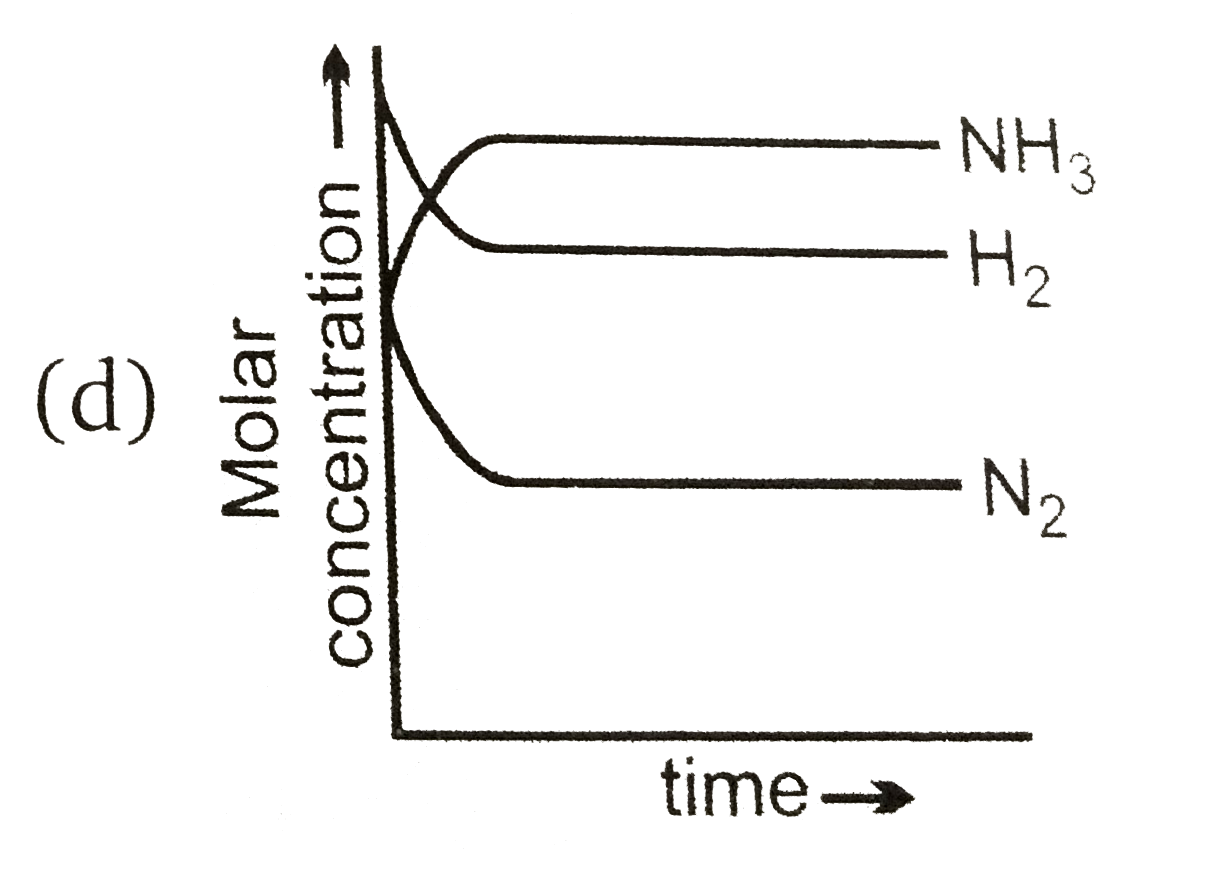
Home
Class 11
CHEMISTRY
For the synthesis of ammonia by the reac...

For the synthesis of ammonia by the reaction `N_(2)+3H_(2)hArr2NH_(3)` in the Haber's process ,the attainment of equilibrium is correctly predicated bt the curve

A

B

C

D

Text Solution

AI Generated Solution

The correct Answer is:
To solve the question regarding the synthesis of ammonia in the Haber process and the correct prediction of equilibrium by a graph, we can follow these steps: ### Step-by-Step Solution: 1. **Understand the Reaction**: The reaction for the synthesis of ammonia is given by: \[ N_2 + 3H_2 \rightleftharpoons 2NH_3 \] This indicates that one mole of nitrogen reacts with three moles of hydrogen to produce two moles of ammonia. 2. **Initial Concentrations**: At the start of the reaction (time \( t_0 \)), only the reactants (nitrogen and hydrogen) are present. Therefore: - Concentration of \( N_2 \) = \( \frac{A}{V} \) (where \( A \) is the initial moles of \( N_2 \)) - Concentration of \( H_2 \) = \( \frac{B}{V} \) (where \( B \) is the initial moles of \( H_2 \)) - Concentration of \( NH_3 \) = 0 3. **Change in Concentrations at Equilibrium**: As the reaction proceeds towards equilibrium, some of the reactants will be converted into products. Let \( x \) be the amount of \( N_2 \) that reacts: - Concentration of \( N_2 \) at equilibrium = \( \frac{A - x}{V} \) - Concentration of \( H_2 \) at equilibrium = \( \frac{B - 3x}{V} \) - Concentration of \( NH_3 \) at equilibrium = \( \frac{2x}{V} \) 4. **Graph Analysis**: The question asks which graph correctly represents the attainment of equilibrium: - At \( t_0 \), the concentration of \( NH_3 \) should be zero. - As the reaction progresses, the concentration of \( NH_3 \) will increase, while the concentrations of \( N_2 \) and \( H_2 \) will decrease. - At equilibrium, the concentrations of all species will remain constant. 5. **Identifying the Correct Graph**: The correct graph should show: - \( NH_3 \) starting from zero and increasing until it reaches a constant value. - \( N_2 \) and \( H_2 \) starting from their initial concentrations and decreasing until they reach constant values at equilibrium. 6. **Conclusion**: Based on the analysis, the graph that shows \( NH_3 \) starting from zero and increasing, while \( N_2 \) and \( H_2 \) decrease and then stabilize, is the correct representation of the equilibrium state in the Haber process. ### Final Answer: The correct option is **A**, as it accurately depicts the changes in concentrations during the attainment of equilibrium in the Haber process. ---
Promotional Banner

Similar Questions

Explore conceptually related problems

In the Haber’s process of synthesis of NH_3

For N_(2)+3H_(3) hArr 2NH_(3)+"Heat"

For the the manufacture of ammonia by the reaction N_(2)+3H_(2)hArr 2NH_(3)+"21.9 Kcal." the favourable condition are

In a chemical reaction N_(2)+3H_(2) hArr 2NH_(3) , at equilibrium point

In the reaction N_(2)(g)+3H_(2)(g)hArr 2NH_(3)(g) , the value of the equlibrium constant depends on

For a reaction N_(2)+3H_(2)hArr2NH_(3) , the value of K_(C) does not depends upon:

In the reaction, N_2(g) +3H_2(g) hArr 2NH_3(g) the value of the equilibrium constant depends on

For the reaction N_(2)(g) + 3H_(2)(g) hArr 2NH_(3)(g), DeltaH=?

1 mol of N_(2) is mixed with 3 mol of H_(2) in a litre container. If 50% of N_(2) is converted into ammonia by the reaction N_(2)(g)+3H_(2)(g) hArr 2NH_(3)(g) , then the total number of moles of gas at the equilibrium are

For the reaction : N_(2(g))+3H_(2(g))hArr2NH_(3(g)) , DeltaH=-ve , the correct statement is :