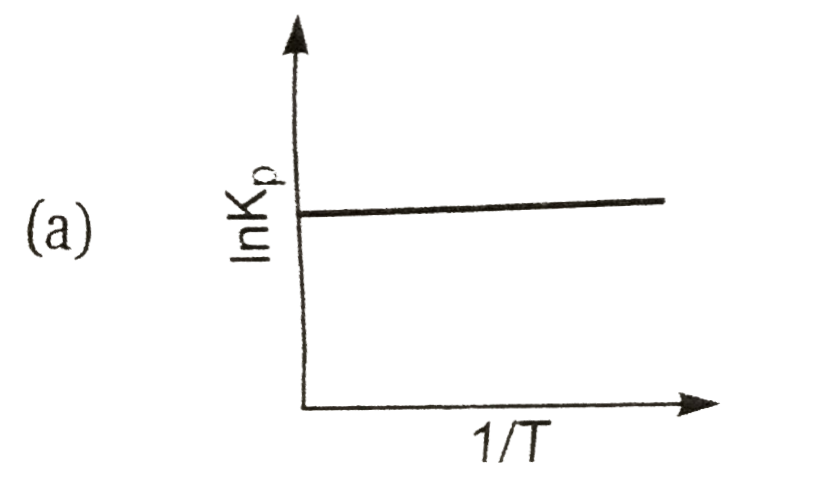
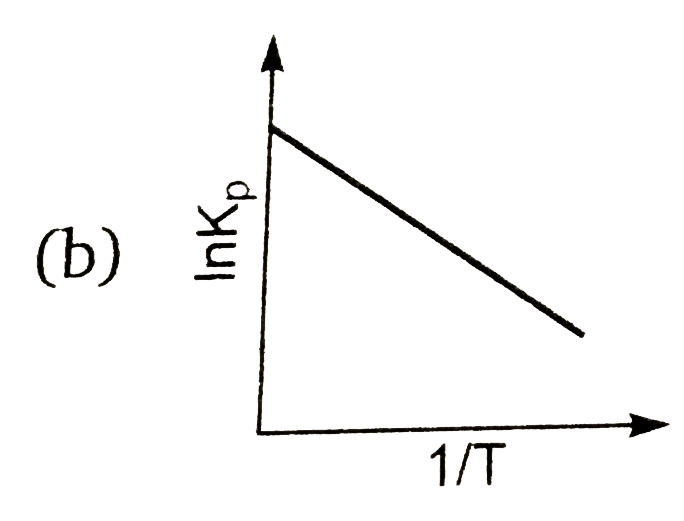
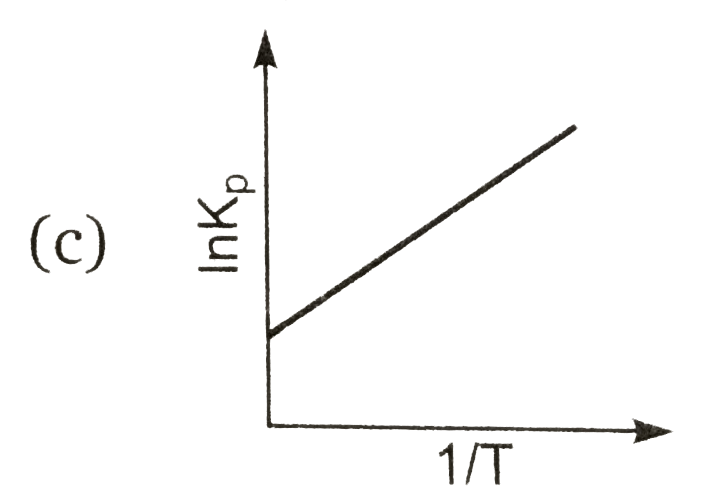
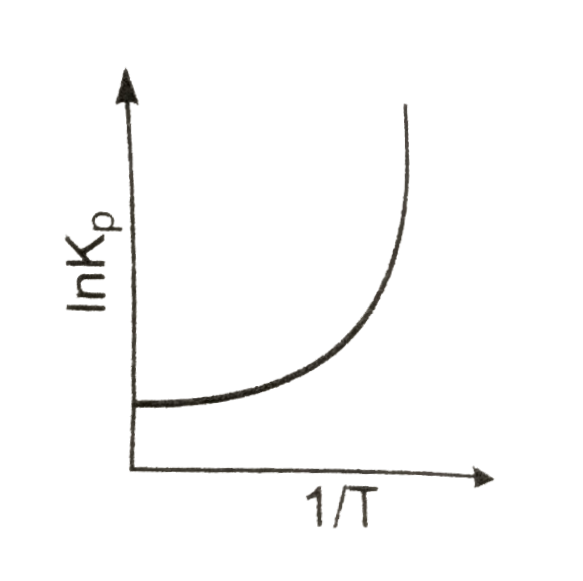
Home
Class 11
CHEMISTRY
An endothermic reaction is represented b...

An endothermic reaction is represented by the graph :

A

B

C

D

Text Solution

AI Generated Solution

The correct Answer is:
To solve the question regarding the representation of an endothermic reaction through a graph, we will follow these steps: ### Step-by-Step Solution: 1. **Understand the Thermodynamic Equation**: We start with the fundamental thermodynamic equation: \[ \Delta G^\circ = \Delta H^\circ - T \Delta S^\circ \] where: - \(\Delta G^\circ\) = standard free energy change - \(\Delta H^\circ\) = standard enthalpy change - \(T\) = temperature - \(\Delta S^\circ\) = standard entropy change 2. **Relate \(\Delta G^\circ\) to the Equilibrium Constant**: The standard free energy change is related to the equilibrium constant \(K_p\) as follows: \[ \Delta G^\circ = -RT \ln K_p \] where \(R\) is the universal gas constant. 3. **Substitute into the Thermodynamic Equation**: By substituting the expression for \(\Delta G^\circ\) into the first equation, we get: \[ -RT \ln K_p = \Delta H^\circ - T \Delta S^\circ \] 4. **Rearranging the Equation**: Rearranging the equation gives: \[ \ln K_p = -\frac{\Delta H^\circ}{R} \cdot \frac{1}{T} + \frac{\Delta S^\circ}{R} \] This can be recognized as the equation of a straight line \(y = mx + c\), where: - \(y = \ln K_p\) - \(x = \frac{1}{T}\) - \(m = -\frac{\Delta H^\circ}{R}\) (slope) - \(c = \frac{\Delta S^\circ}{R}\) (y-intercept) 5. **Determine the Slope for Endothermic Reactions**: For an endothermic reaction, \(\Delta H^\circ\) is positive. Therefore, the slope \(m\) will be negative: \[ m = -\frac{\Delta H^\circ}{R} < 0 \] 6. **Analyze the Graph Options**: Since we are looking for a graph where \(\ln K_p\) is plotted against \(\frac{1}{T}\) with a negative slope, we need to identify which graph shows a downward trend as \(x\) (or \(\frac{1}{T}\)) increases. 7. **Select the Correct Graph**: After analyzing the options, the graph that shows a negative slope is the correct representation of an endothermic reaction. ### Conclusion: The graph that represents an endothermic reaction is the one with a negative slope, indicating that as the temperature increases (or \(\frac{1}{T}\) decreases), the value of \(\ln K_p\) also decreases.
Promotional Banner

Similar Questions

Explore conceptually related problems

An exothermic reaction is represented by the graph :

In endothermic reactions,

For an endothermic reaction, where Delta H represents the enthalpy of reaction in kJ mol^(-1) , the minimum value for the energy of activation will be

An endothermic reaction proceeds faster in the forward reaction with decrease in temperature.

An endothermic reaction which proceeds with decrease in volume will give maximum yield of the products at ……….. and …………..

Assertion : DeltaH for an exothermic reaction is negative nad for an endothermic reaction is positive. Reason : Enthalpy is an extensive property.

Which function could represents the graph above?

The motion of a body is represented by the following displacement-time graph. State the type of motion represented in the graph.

Mark the correct choice of electrolytes represented in the graph.

For an endothermic reaction to be spontaneous