Home
Class 11
CHEMISTRY
Which one of these graphs for an ideal g...

Which one of these graphs for an ideal gas havinga fixed amount, the arrow indication, is incorrectly marked ?

A

B

C

D

Text Solution

AI Generated Solution

The correct Answer is:
To determine which graph for an ideal gas with a fixed amount is incorrectly marked, we will analyze the relationships between pressure (P), volume (V), and temperature (T) based on the ideal gas law, PV = nRT. ### Step-by-Step Solution: 1. **Understand the Ideal Gas Law**: The ideal gas law states that PV = nRT, where P is pressure, V is volume, n is the number of moles, R is the ideal gas constant, and T is temperature in Kelvin. 2. **Graph Analysis**: We need to analyze the relationships depicted in the graphs: - **Graph 1**: Pressure vs. Temperature (P-T graph) - **Graph 2**: Volume vs. Temperature (V-T graph) - **Graph 3**: Pressure vs. Volume (P-V graph) 3. **Graph 1 (P-T graph)**: - For a fixed amount of gas, if the volume is held constant, increasing the temperature will increase the pressure. This graph should show a positive slope. - If the graph shows a decreasing slope or negative correlation, it is incorrectly marked. 4. **Graph 2 (V-T graph)**: - This graph represents the relationship between volume and temperature. If we consider the equation in terms of V and T, we can derive that volume increases with temperature at constant pressure. - If the graph shows that volume decreases with increasing temperature, it is incorrectly marked. 5. **Graph 3 (P-V graph)**: - According to Boyle's Law, for a fixed amount of gas at a constant temperature, pressure and volume are inversely related. If volume increases, pressure decreases, and vice versa. This graph should show a negative slope. - If the graph incorrectly shows a positive slope, it is incorrectly marked. 6. **Determine Incorrectly Marked Graph**: - After analyzing the graphs, if any graph shows a relationship that contradicts the established gas laws, that graph is incorrectly marked. - Based on the analysis provided in the transcript, it was concluded that the volume-temperature graph (Graph 2) is incorrectly marked because it suggests that as volume decreases, temperature increases, which contradicts the ideal gas behavior. ### Conclusion: The incorrectly marked graph is the one that shows the relationship between volume and temperature, indicating that volume decreases with increasing temperature.

To determine which graph for an ideal gas with a fixed amount is incorrectly marked, we will analyze the relationships between pressure (P), volume (V), and temperature (T) based on the ideal gas law, PV = nRT. ### Step-by-Step Solution: 1. **Understand the Ideal Gas Law**: The ideal gas law states that PV = nRT, where P is pressure, V is volume, n is the number of moles, R is the ideal gas constant, and T is temperature in Kelvin. 2. **Graph Analysis**: We need to analyze the relationships depicted in the graphs: - **Graph 1**: Pressure vs. Temperature (P-T graph) ...
Promotional Banner

Topper's Solved these Questions

  • GASEOUS STATE

    NARENDRA AWASTHI ENGLISH|Exercise Level 2|30 Videos
  • GASEOUS STATE

    NARENDRA AWASTHI ENGLISH|Exercise Level 3 Passage 1|4 Videos
  • ELECTROCHEMISTRY

    NARENDRA AWASTHI ENGLISH|Exercise Subjective problems|14 Videos
  • IONIC EEQUILIBRIUM

    NARENDRA AWASTHI ENGLISH|Exercise Subjective problems|1 Videos

Similar Questions

Explore conceptually related problems

Which one is incorrectly matched ?

Which one is incorrectly matched

Which one is incorrectly matched pair

Which one of the following is incorrectly matched ?

Which one of the following pair is incorrectly matched ?

Which one is an incorrectly match pair?

Which one of the following paise is incorrectly matched ?

Which one of the following pairs is incorrectly matched ?

Which one is paired incorrectly?

Which one of the following is incorrectly matched?

NARENDRA AWASTHI ENGLISH-GASEOUS STATE-Subjective problems
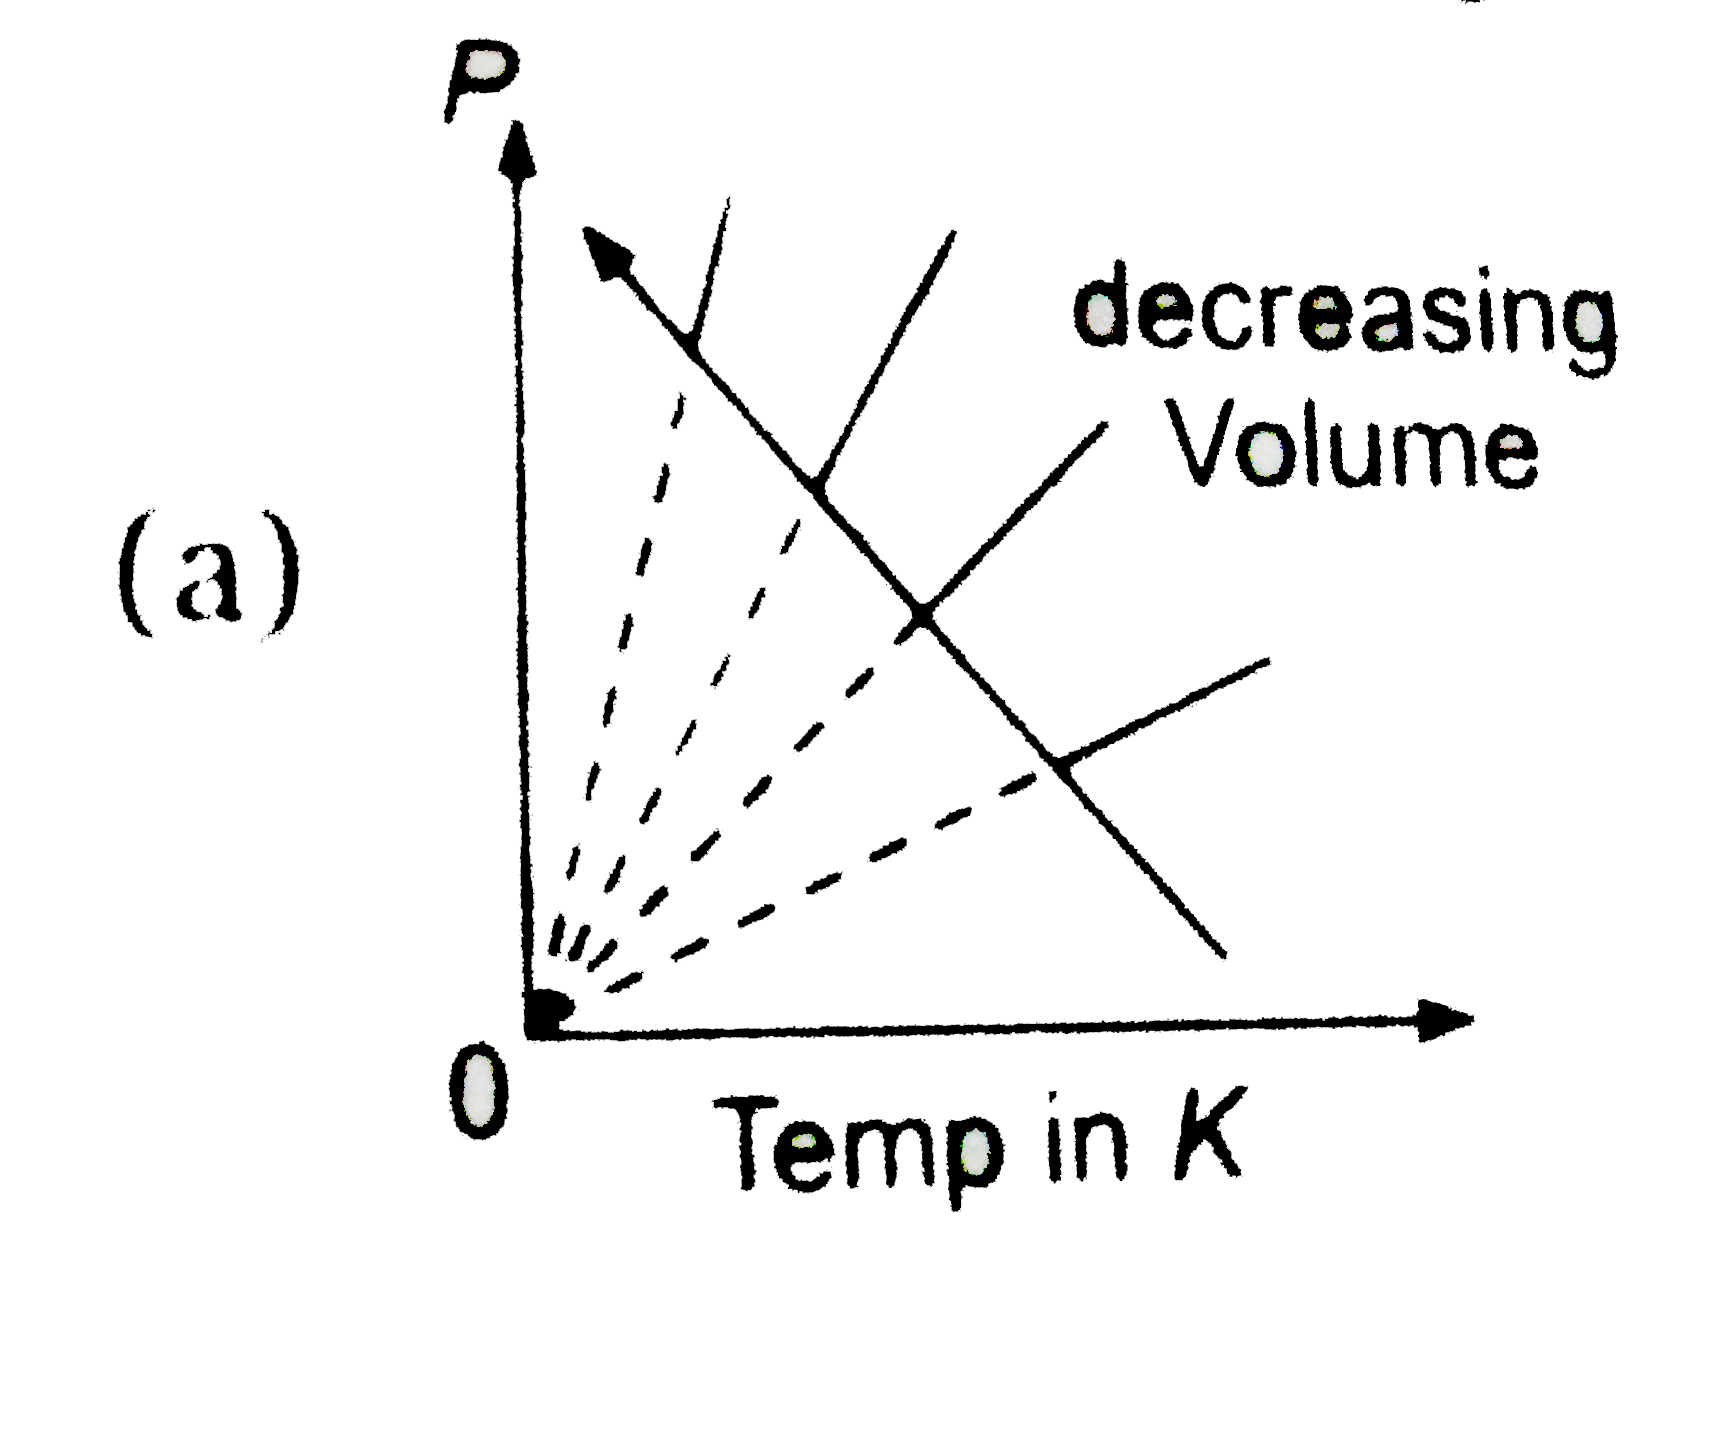
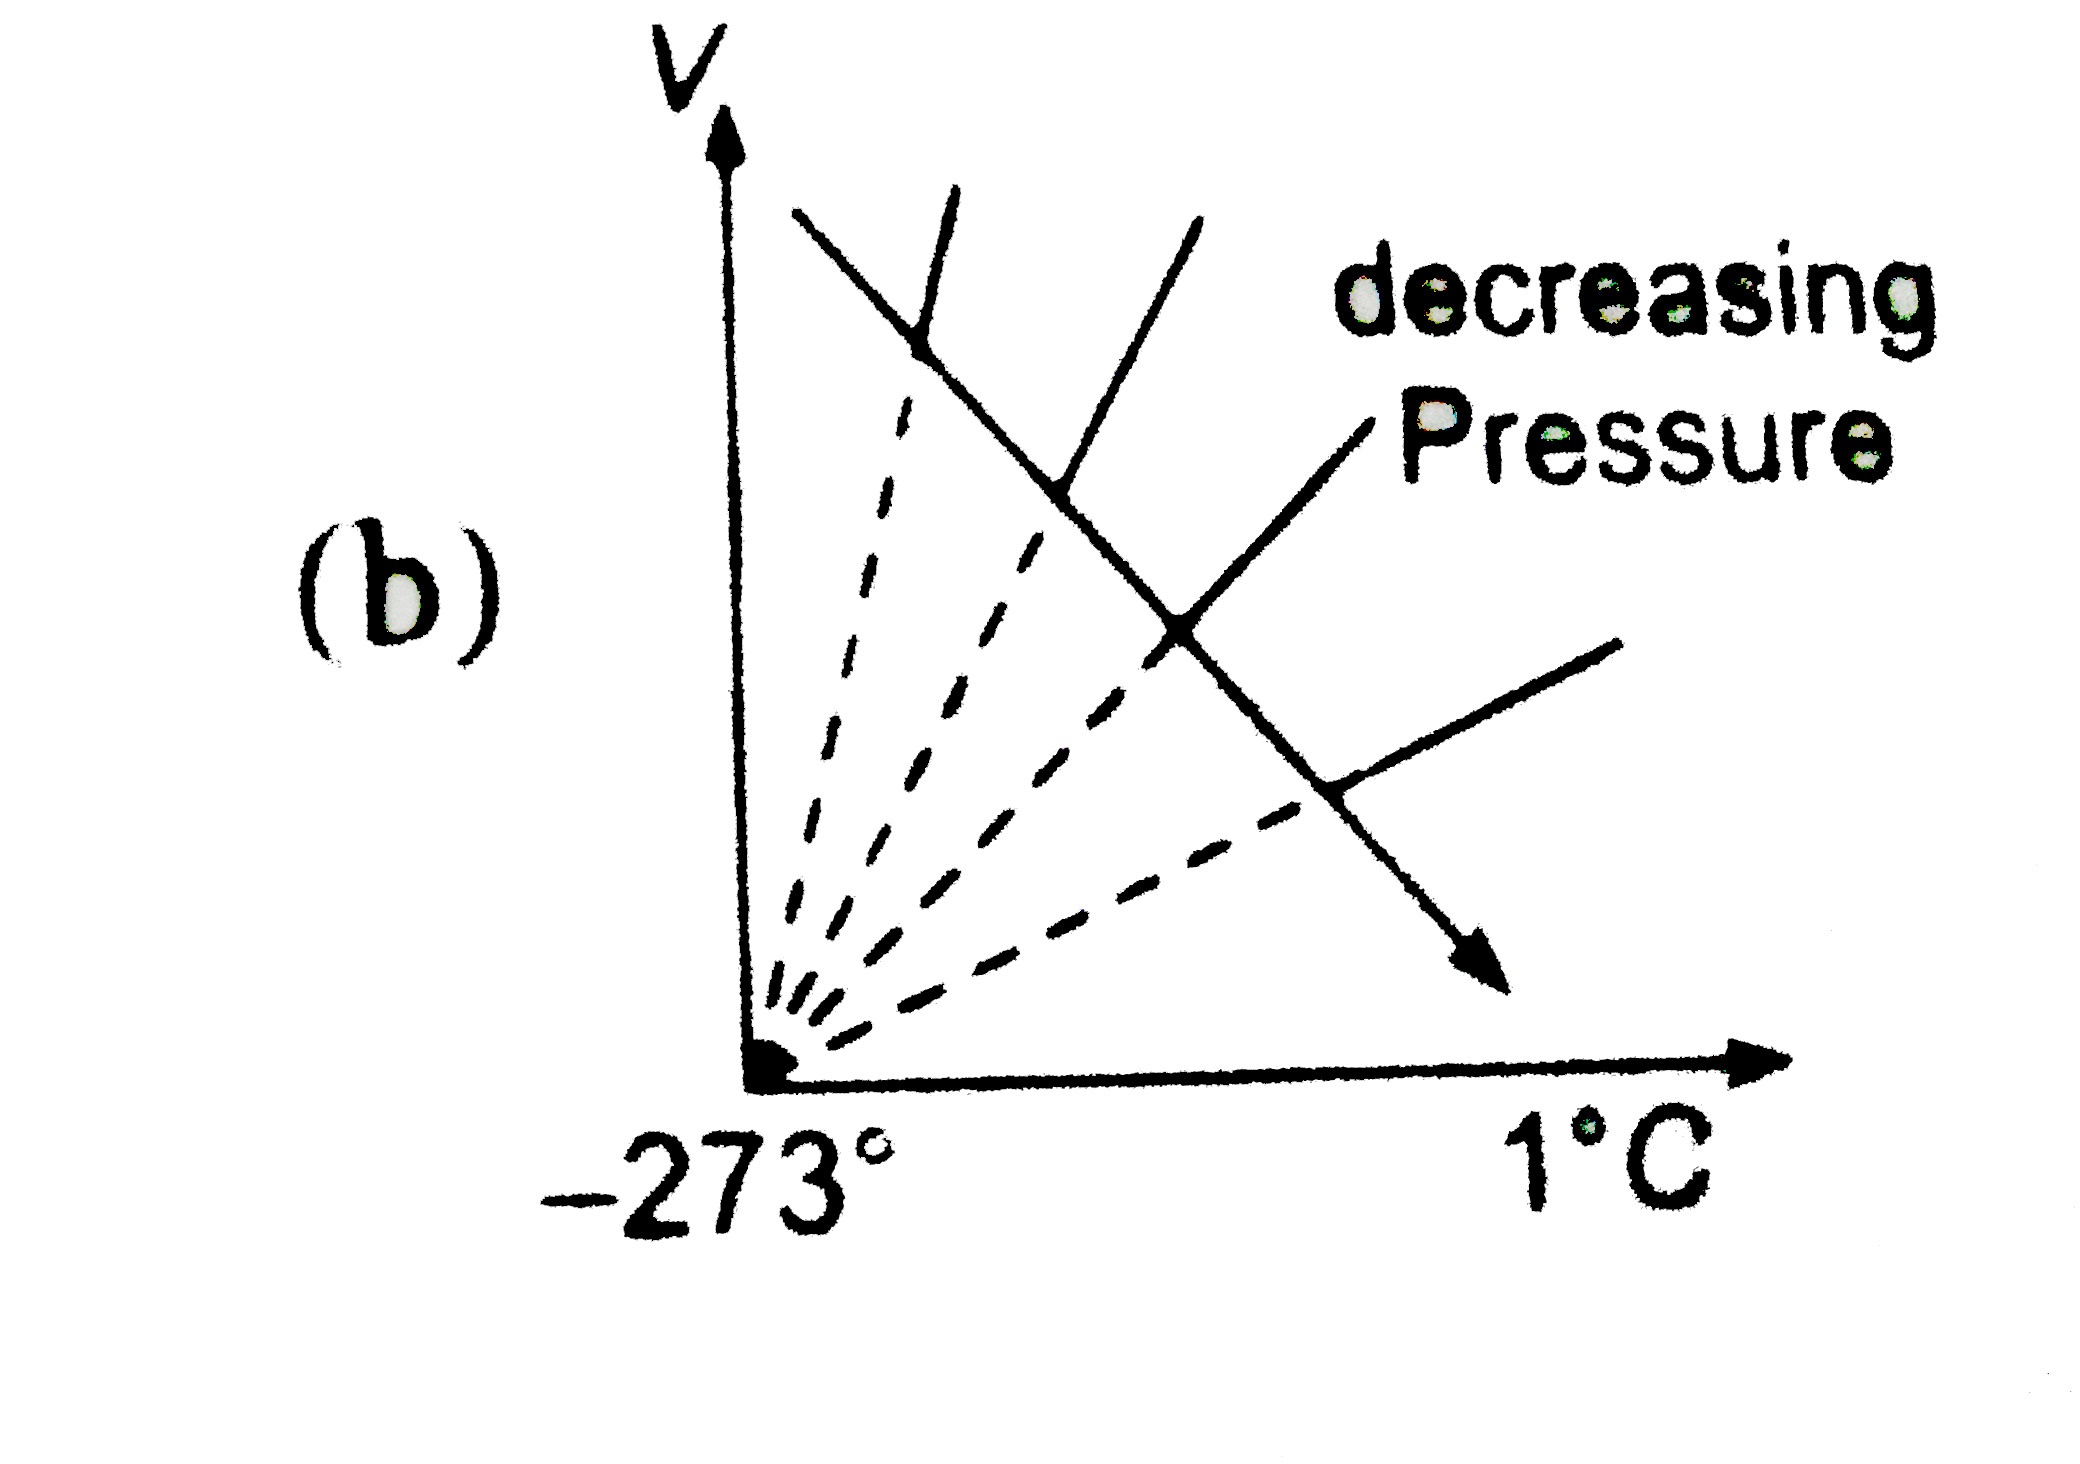
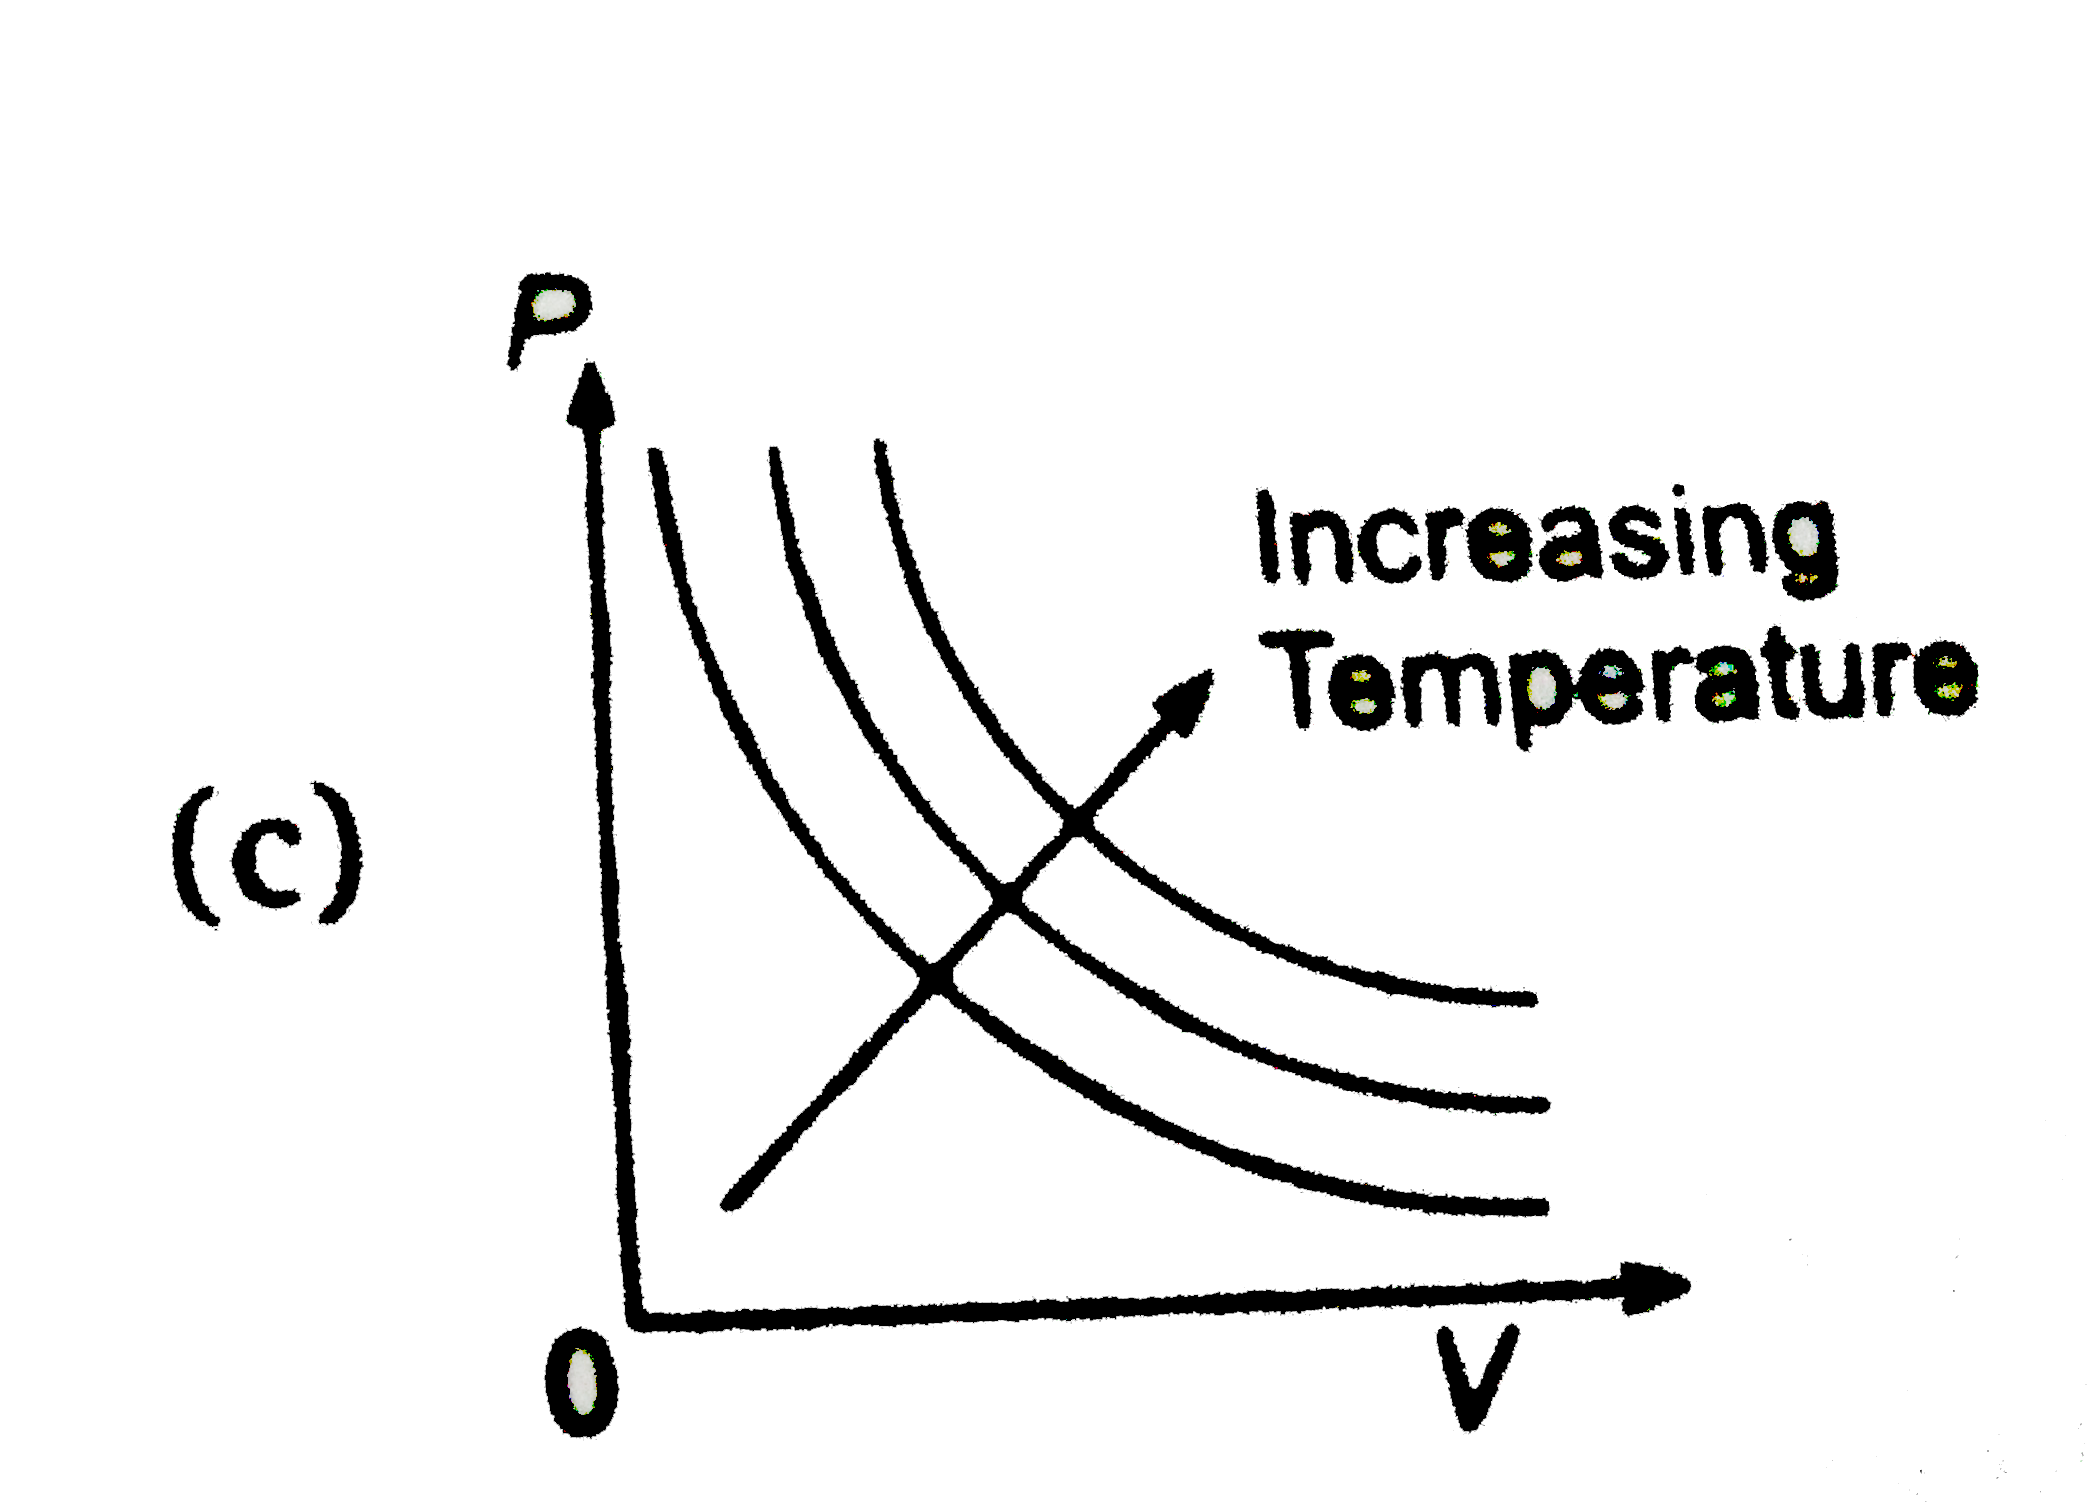
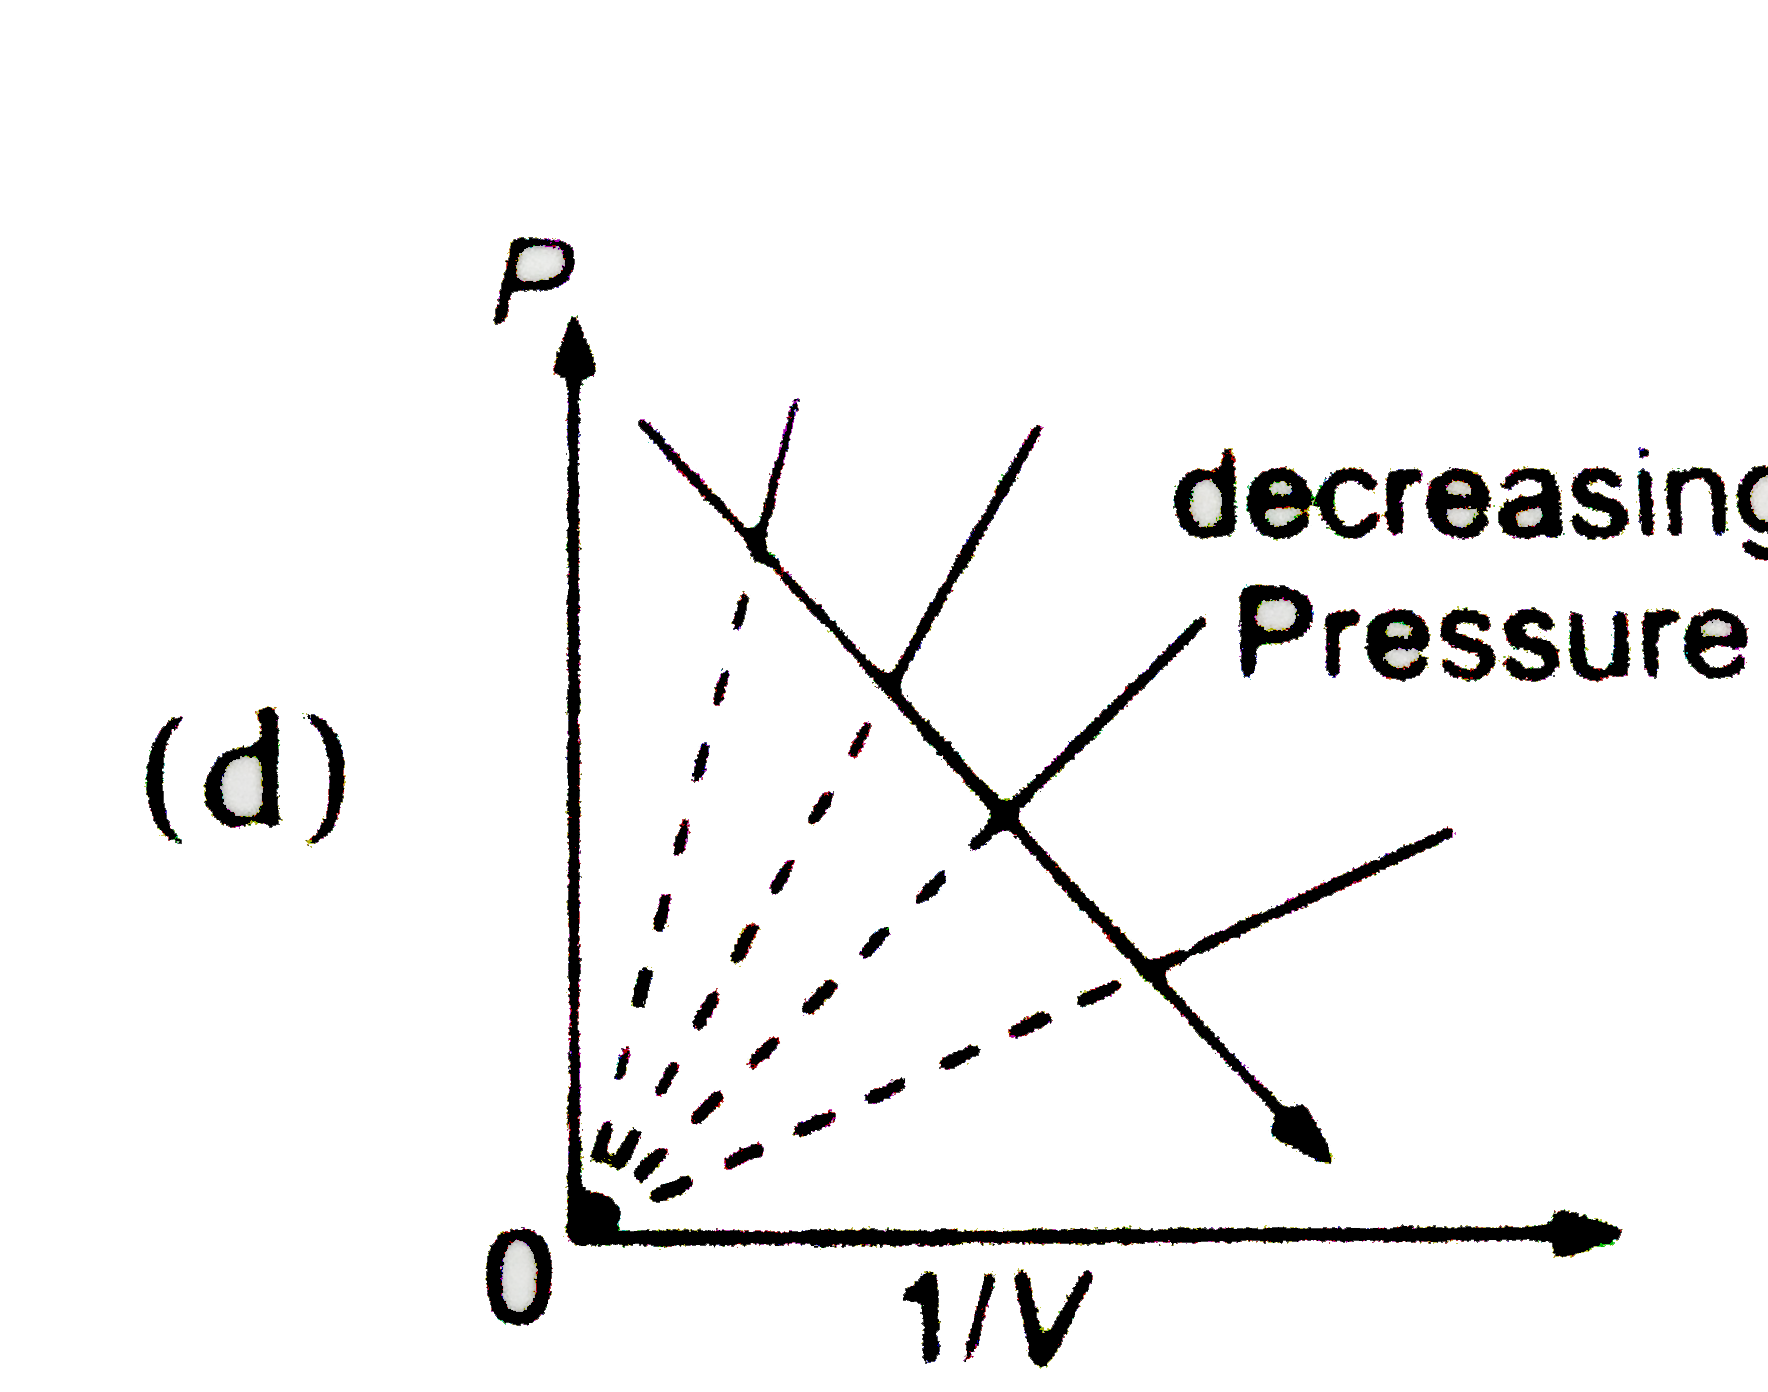
  1. Which one of these graphs for an ideal gas havinga fixed amount, the a...

    Text Solution

    |

  2. A bubble of gas released at the bottom of a lake increases to four t...

    Text Solution

    |

  3. A gaseous mixture containing equal mole sof H(2),O(2) and He is subjec...

    Text Solution

    |

  4. One mole of a gas changed from its initial state (15L,2 atm) to final ...

    Text Solution

    |

  5. Two moles of an ideal gas undergoes the following process. Given that ...

    Text Solution

    |

  6. 1 mole of a diatomic gas present in 10 L vessel at certain temperature...

    Text Solution

    |

  7. The graph of compressibility factor (Z) vs. P for one mole of a real g...

    Text Solution

    |

  8. Under the identical conditions of temperature, the density of a gas X...

    Text Solution

    |

  9. The time for a certain volume of a gas A to diffuse through a small ho...

    Text Solution

    |

  10. Excess F(2)(g) reacts at 150^(@)C and 1.0 atm pressure with Br(2)(g) t...

    Text Solution

    |

  11. Initially bulb "a" contained oxygen gas at 27^(@)C and 950 mm of Hg an...

    Text Solution

    |

  12. Air is trapped in a horizontal glass tube by 36 cm mercury column as s...

    Text Solution

    |

  13. A flask containing air at 107^(@)C and 722 mm of Hg is cooled to 100 K...

    Text Solution

    |

  14. If an ideal gas at 100 K is heated to 109 K in a rigid container, the ...

    Text Solution

    |

  15. The van der Waals' constantes for a gas are a=3.6 atmL^(2)mol^(-2),b=0...

    Text Solution

    |

  16. A flask has 10 molecules out of which four molecules are moving at 7 m...

    Text Solution

    |