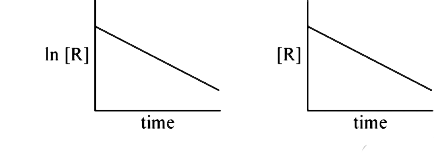
The given plots represent the variation of the concentration of a reactant R with time for different reactions (i) and (ii). The respective orders of the reactions are:
A
`1, 0`
B
`1, 1`
C
`0, 1`
D
`0, 2`
Text Solution
Verified by Experts
The correct Answer is:
A
Topper's Solved these Questions
JEE MAINS
JEE MAINS PREVIOUS YEAR ENGLISH|Exercise QUESTION|1 Videos
JEE MAIN
JEE MAINS PREVIOUS YEAR ENGLISH|Exercise CHEMISTRY|146 Videos
JEE MAINS 2020
JEE MAINS PREVIOUS YEAR ENGLISH|Exercise CHEMSITRY|23 Videos
Similar Questions
Explore conceptually related problems
The given plots represent the variation of the concentration of a reactant R with time for different reactions (i) and (ii). The sum of orders of the reactions is ________ .
If the concentration of the reactants is increased, the rate of reaction for first order-
When initial concentration of a reactant is doubled in a reaction, its half-life period is not affected. The order of the reaction is
A : Rate of reaction depends upon the concentration of the reactants. R : The order of reaction can be negative with respect to substance present in the reaction.
[r]= concentration of reactant and t be the time Identify the correct option for order-
Raiisng the concentration of a particular reactant by a factor of 5 increases the reaction rate 25 times. What is the kinetic order of this reactant?
In a first order reaction, the concentration of the reactants is reduced to 25% in one hour. The half-life periof of the reactions is
In the reaction A to B , if the concentration of A is plotted against time, the curves obtained will be as shown in Fig. 1 and 2. Predict the order of the reactions.
JEE MAINS PREVIOUS YEAR ENGLISH-JEE MAINS-QUESTION