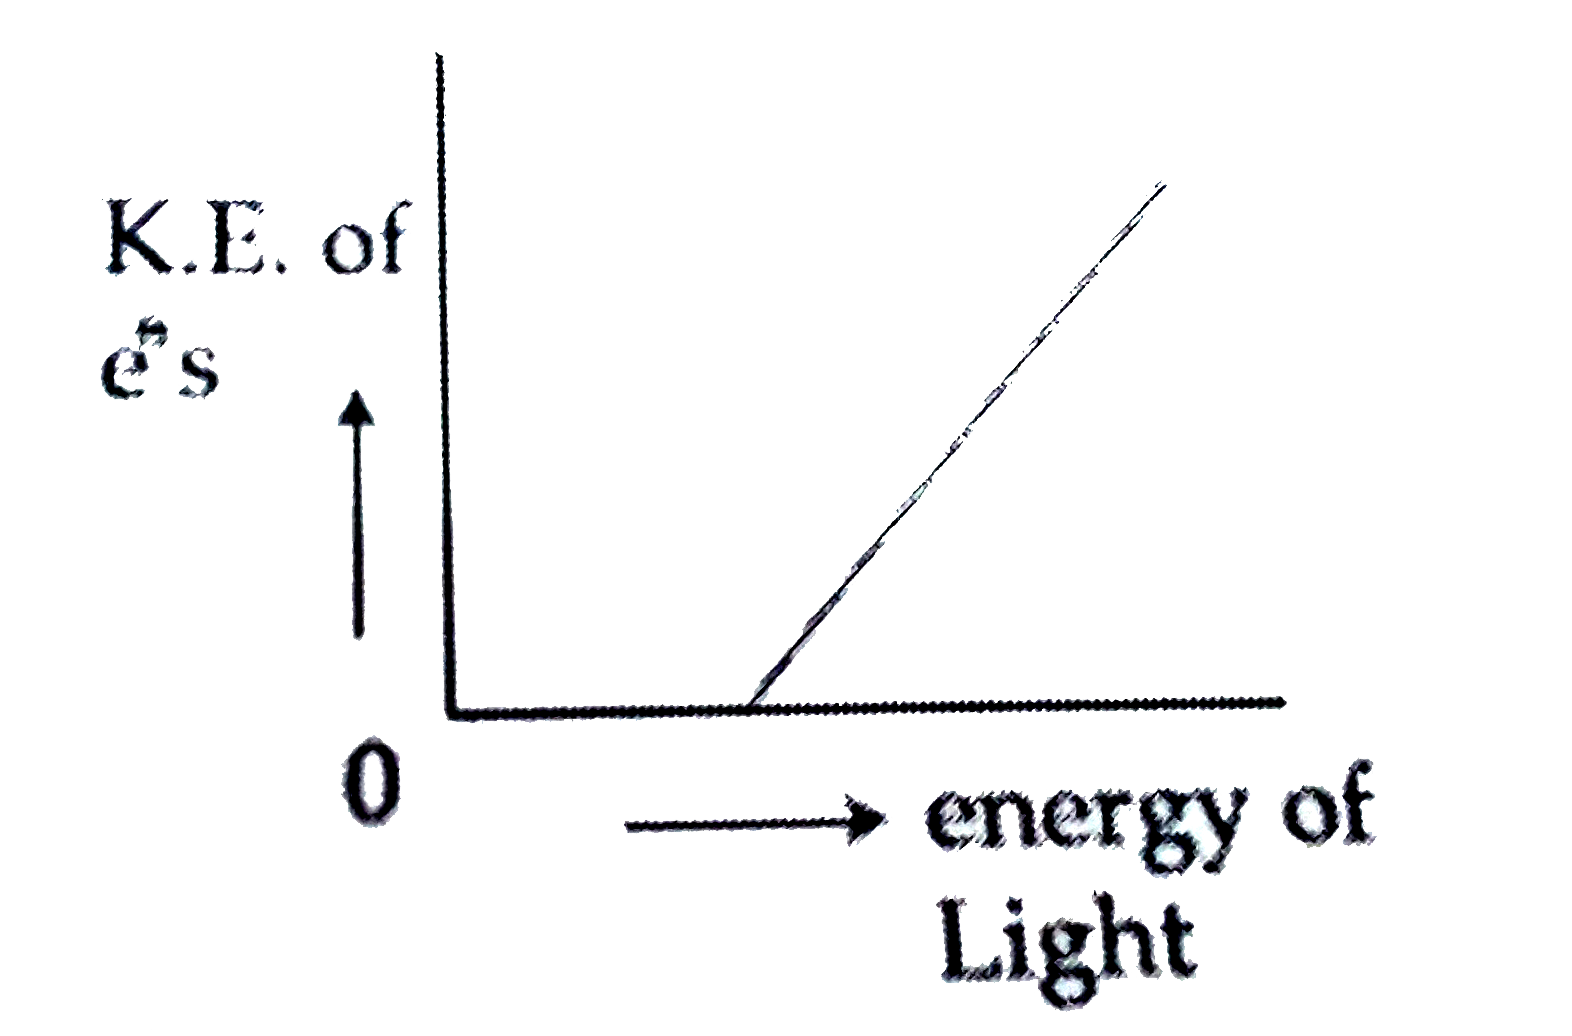
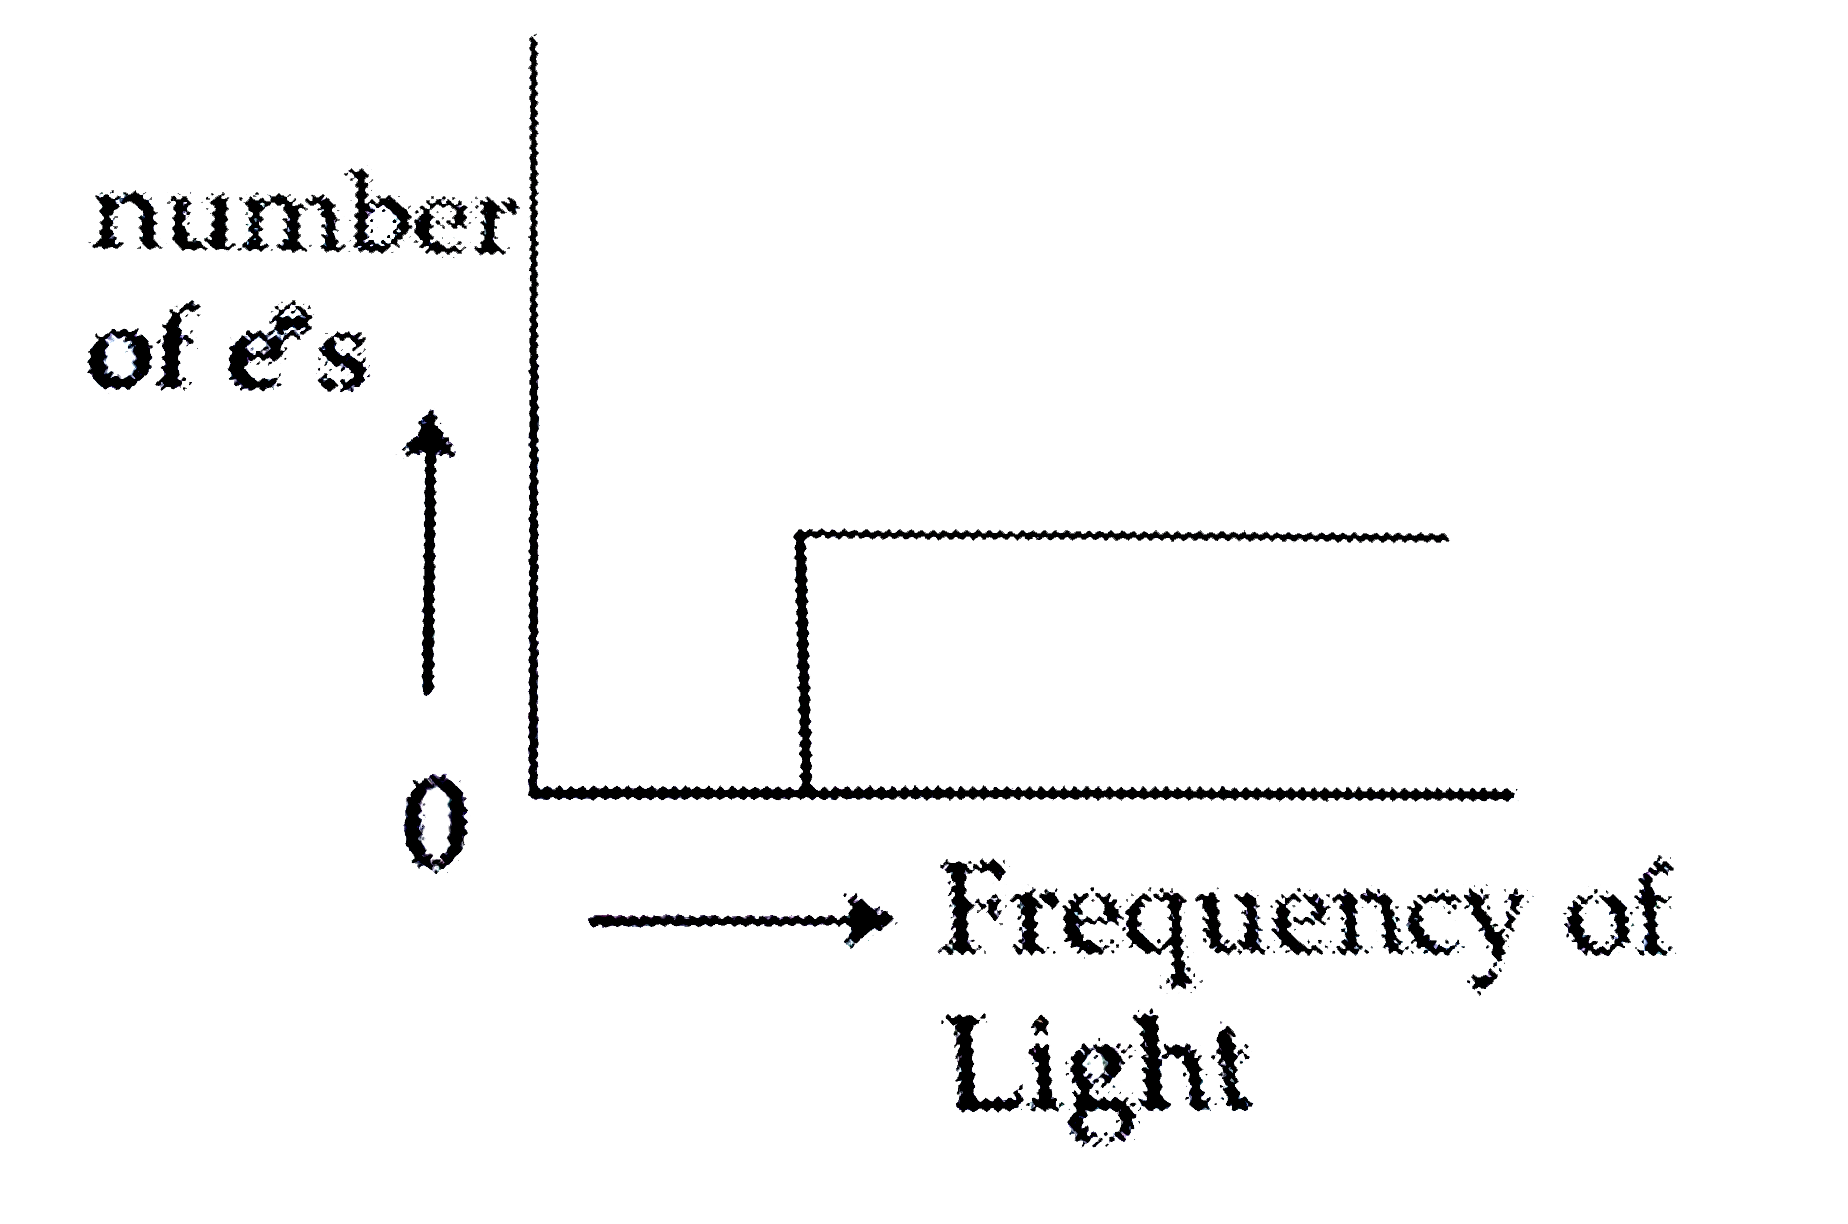
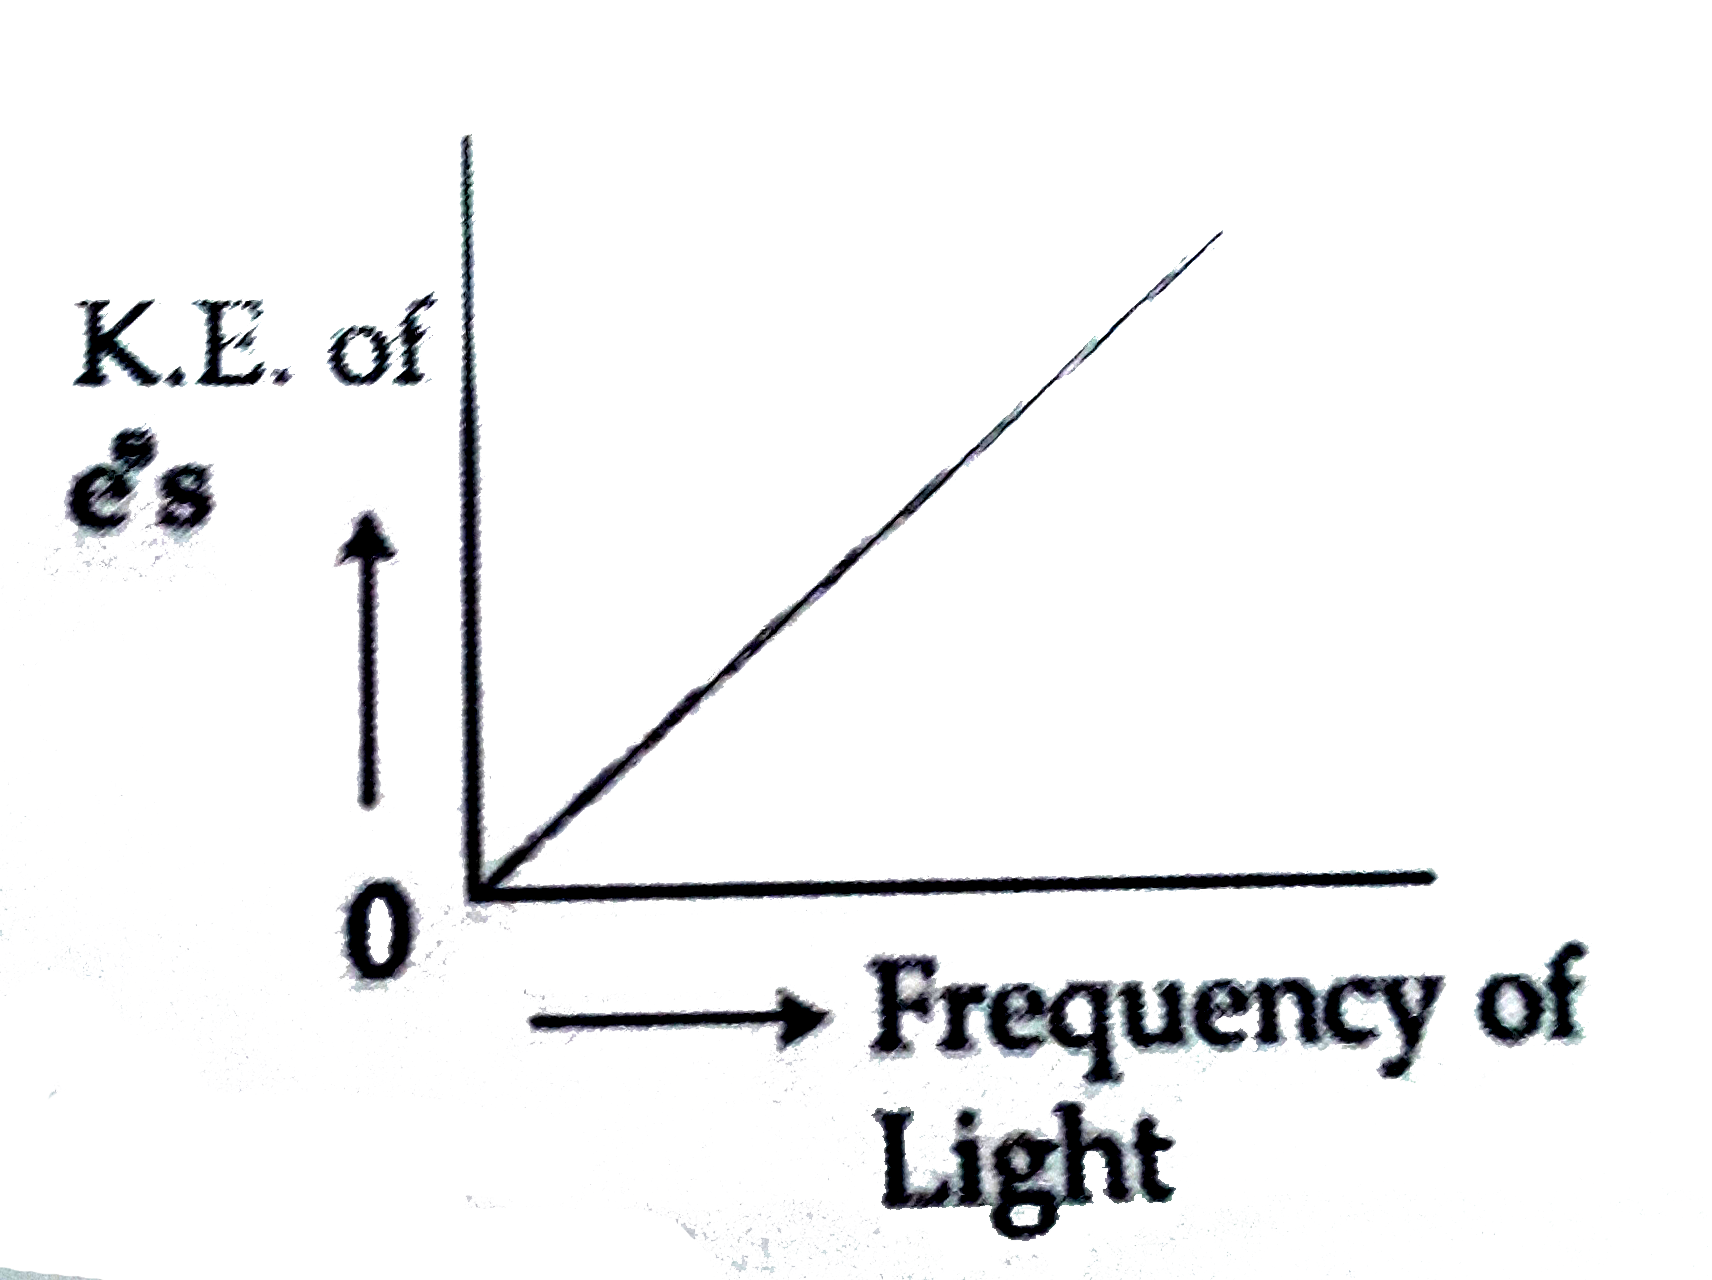
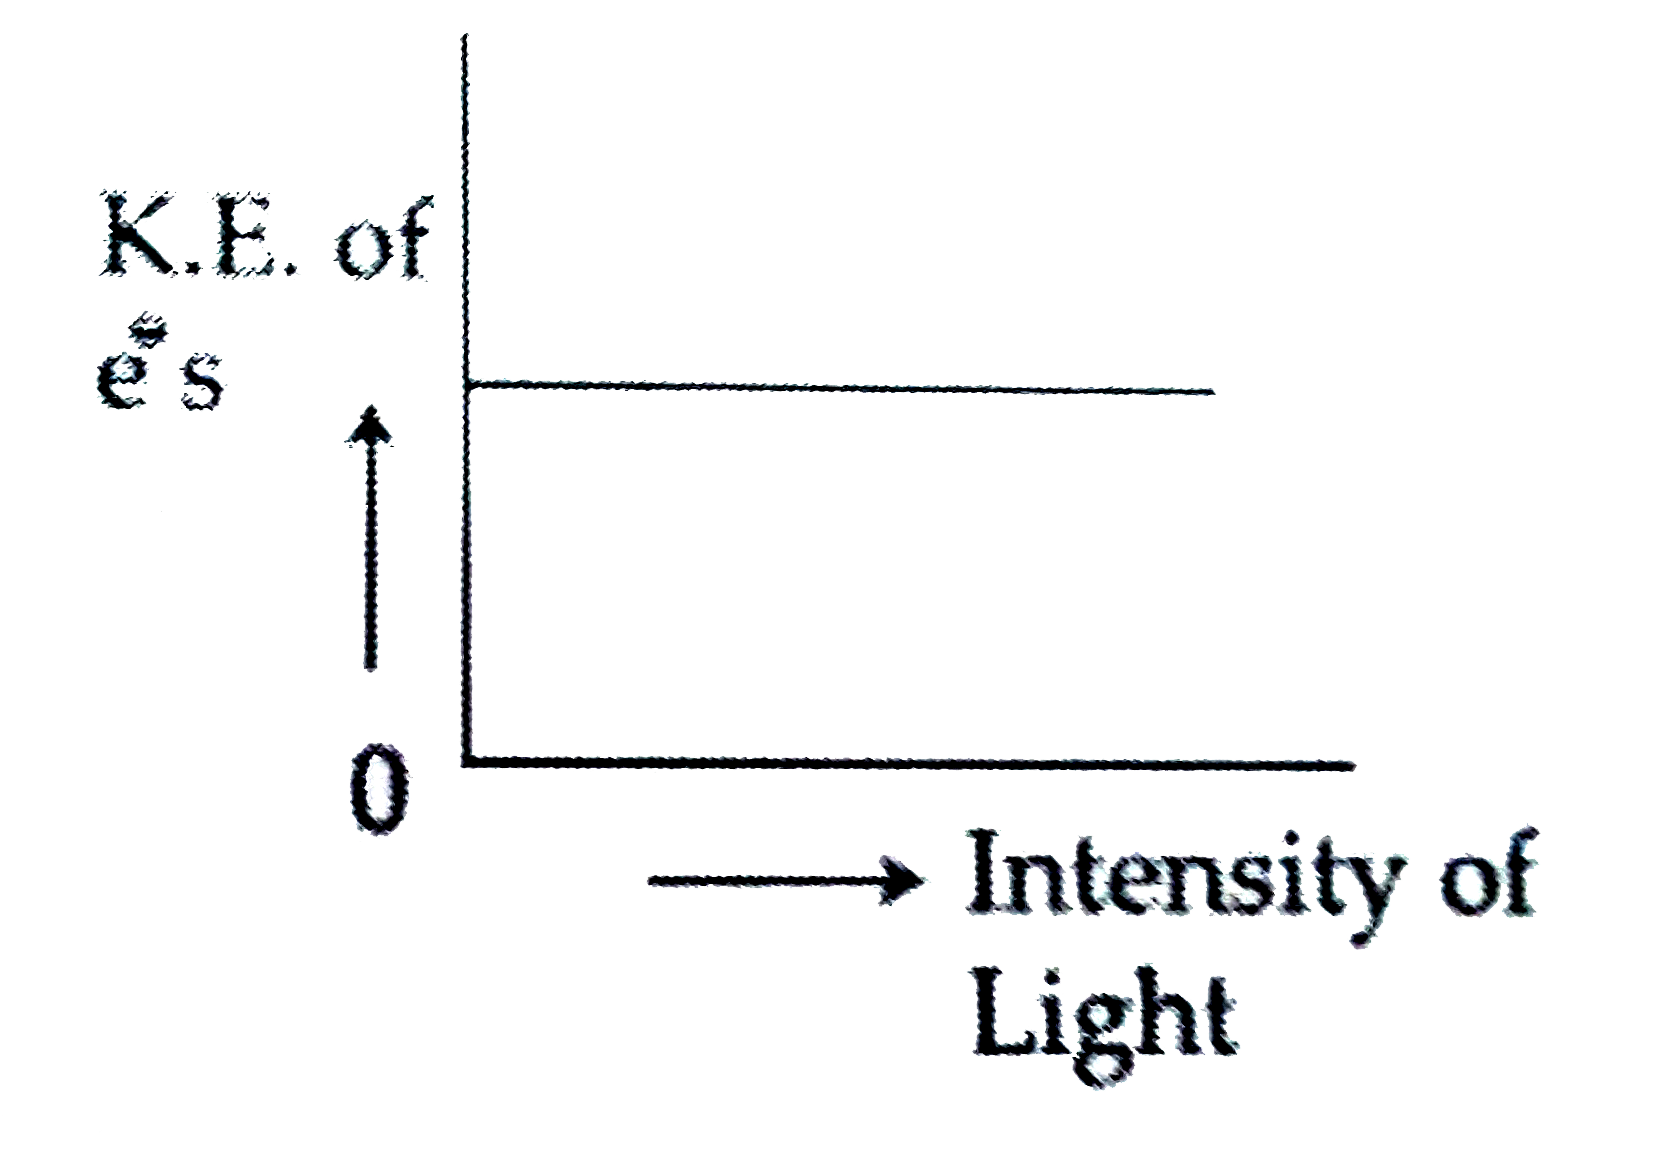
Which of the graphs shown below does not represent the relationship between incident light and the electron ejected from metal surface ?
A
B
C
D
Text Solution
AI Generated Solution
Topper's Solved these Questions
JEE MAINS
JEE MAINS PREVIOUS YEAR ENGLISH|Exercise QUESTION|1 Videos
JEE MAIN
JEE MAINS PREVIOUS YEAR ENGLISH|Exercise CHEMISTRY|146 Videos
JEE MAINS 2020
JEE MAINS PREVIOUS YEAR ENGLISH|Exercise CHEMSITRY|23 Videos
Similar Questions
Explore conceptually related problems
Relationship between incident light and CO_2 fixation rate is
Which graph best represent the relationship between conductivity and resistivity for a solid ?
Linear relationship exists between incident light and rate of CO_(2) fixation at/in.
If lamda_o and lamda be the threshold wavelength and wavelength of incident light , the velocity of photoelectron ejected from the metal surface is :
Which of the following graphs represents the relationship between the force F between two point charges and the distance r between them :
The graph shown represents which of the following equations ?
Which of the following equations represents the line shown in the graph?
Assertion : The number of electrons ejected from a metal surface depend upon the frequency of light. Reason : There is a time lag between the striking of light beam and the ejection of electrons from the metal surface.
A metal surface in an evacuated tube is illuminated with monochromatic light causing the emission of photoelectrons. For a given intensity of light, a graph between saturation current and potential of the electrode is given in Fig. If the experiment were repeated with light of twice the intensity but the same wavelength, which of the graphs below would best represent the new relation between I and V?(Dotted represents initial condition)
Which one of the following function best represents the graphs as shown below?
JEE MAINS PREVIOUS YEAR ENGLISH-JEE MAINS-QUESTION