A
B
C
D
Text Solution
Verified by Experts


Similar Questions
Explore conceptually related problems
Recommended Questions
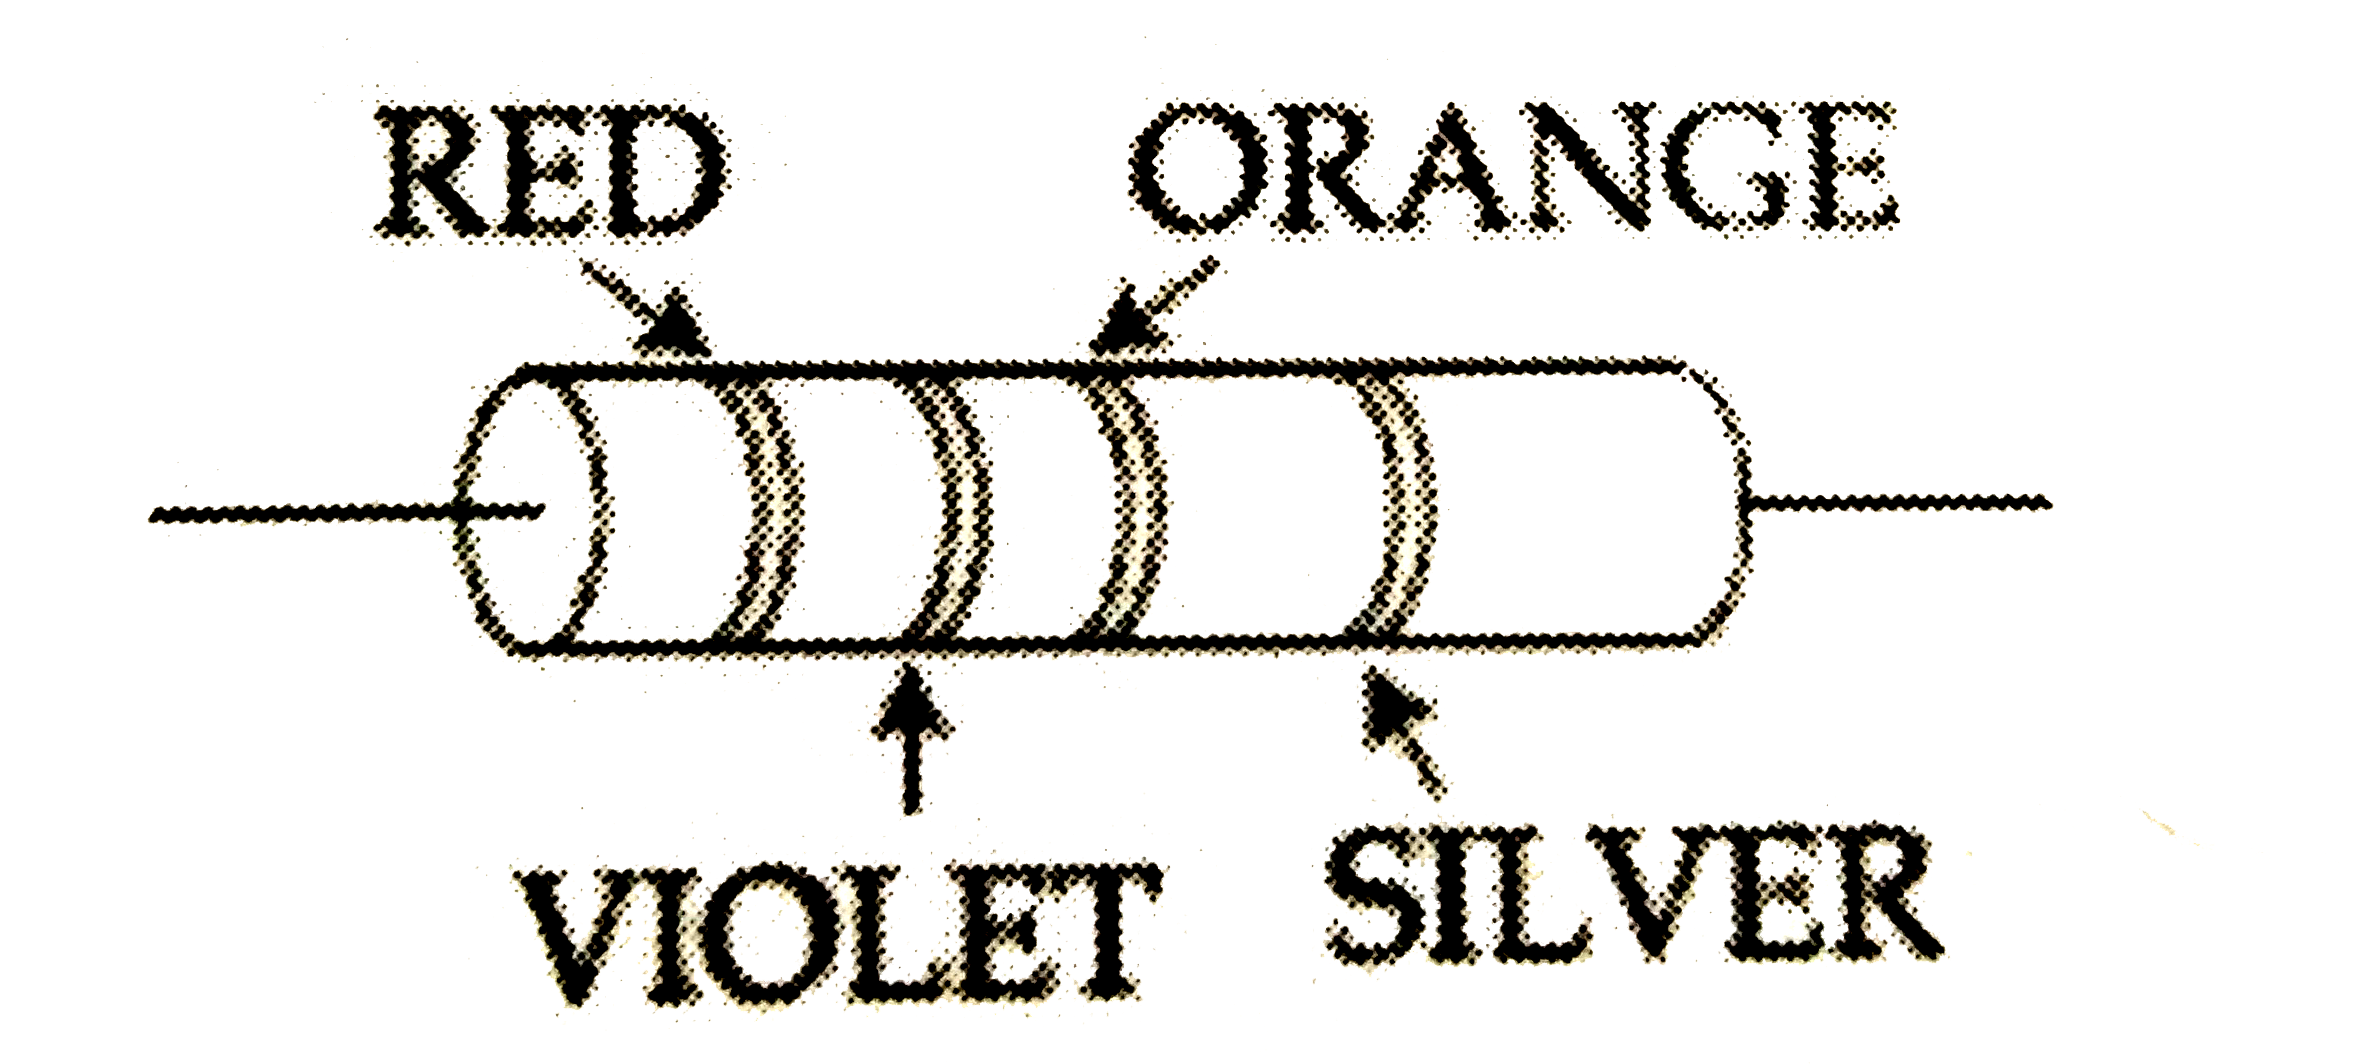
- A resistance is shown in the figure. Its value and tolerance are given...
Text Solution
|
- In the given network shown in the figure, the equivalent resistance is...
Text Solution
|
- In a circuit shown in figure if the internal resistance of the sources...
Text Solution
|
- In the circuit shown in the given figure, the resistances R(1) and R(2...
Text Solution
|
- A resistance is shown in the figure. Its value and tolerance are given...
Text Solution
|
- A resistance is shown in the figure. Its value and tolerance are given...
Text Solution
|
- A resistance is shown in the figure. Its value and tolerance are given...
Text Solution
|
- The color code of a resistance is given below: The value of resistance...
Text Solution
|
- A carbon resistance has coloured strips as shown in figure. What is it...
Text Solution
|