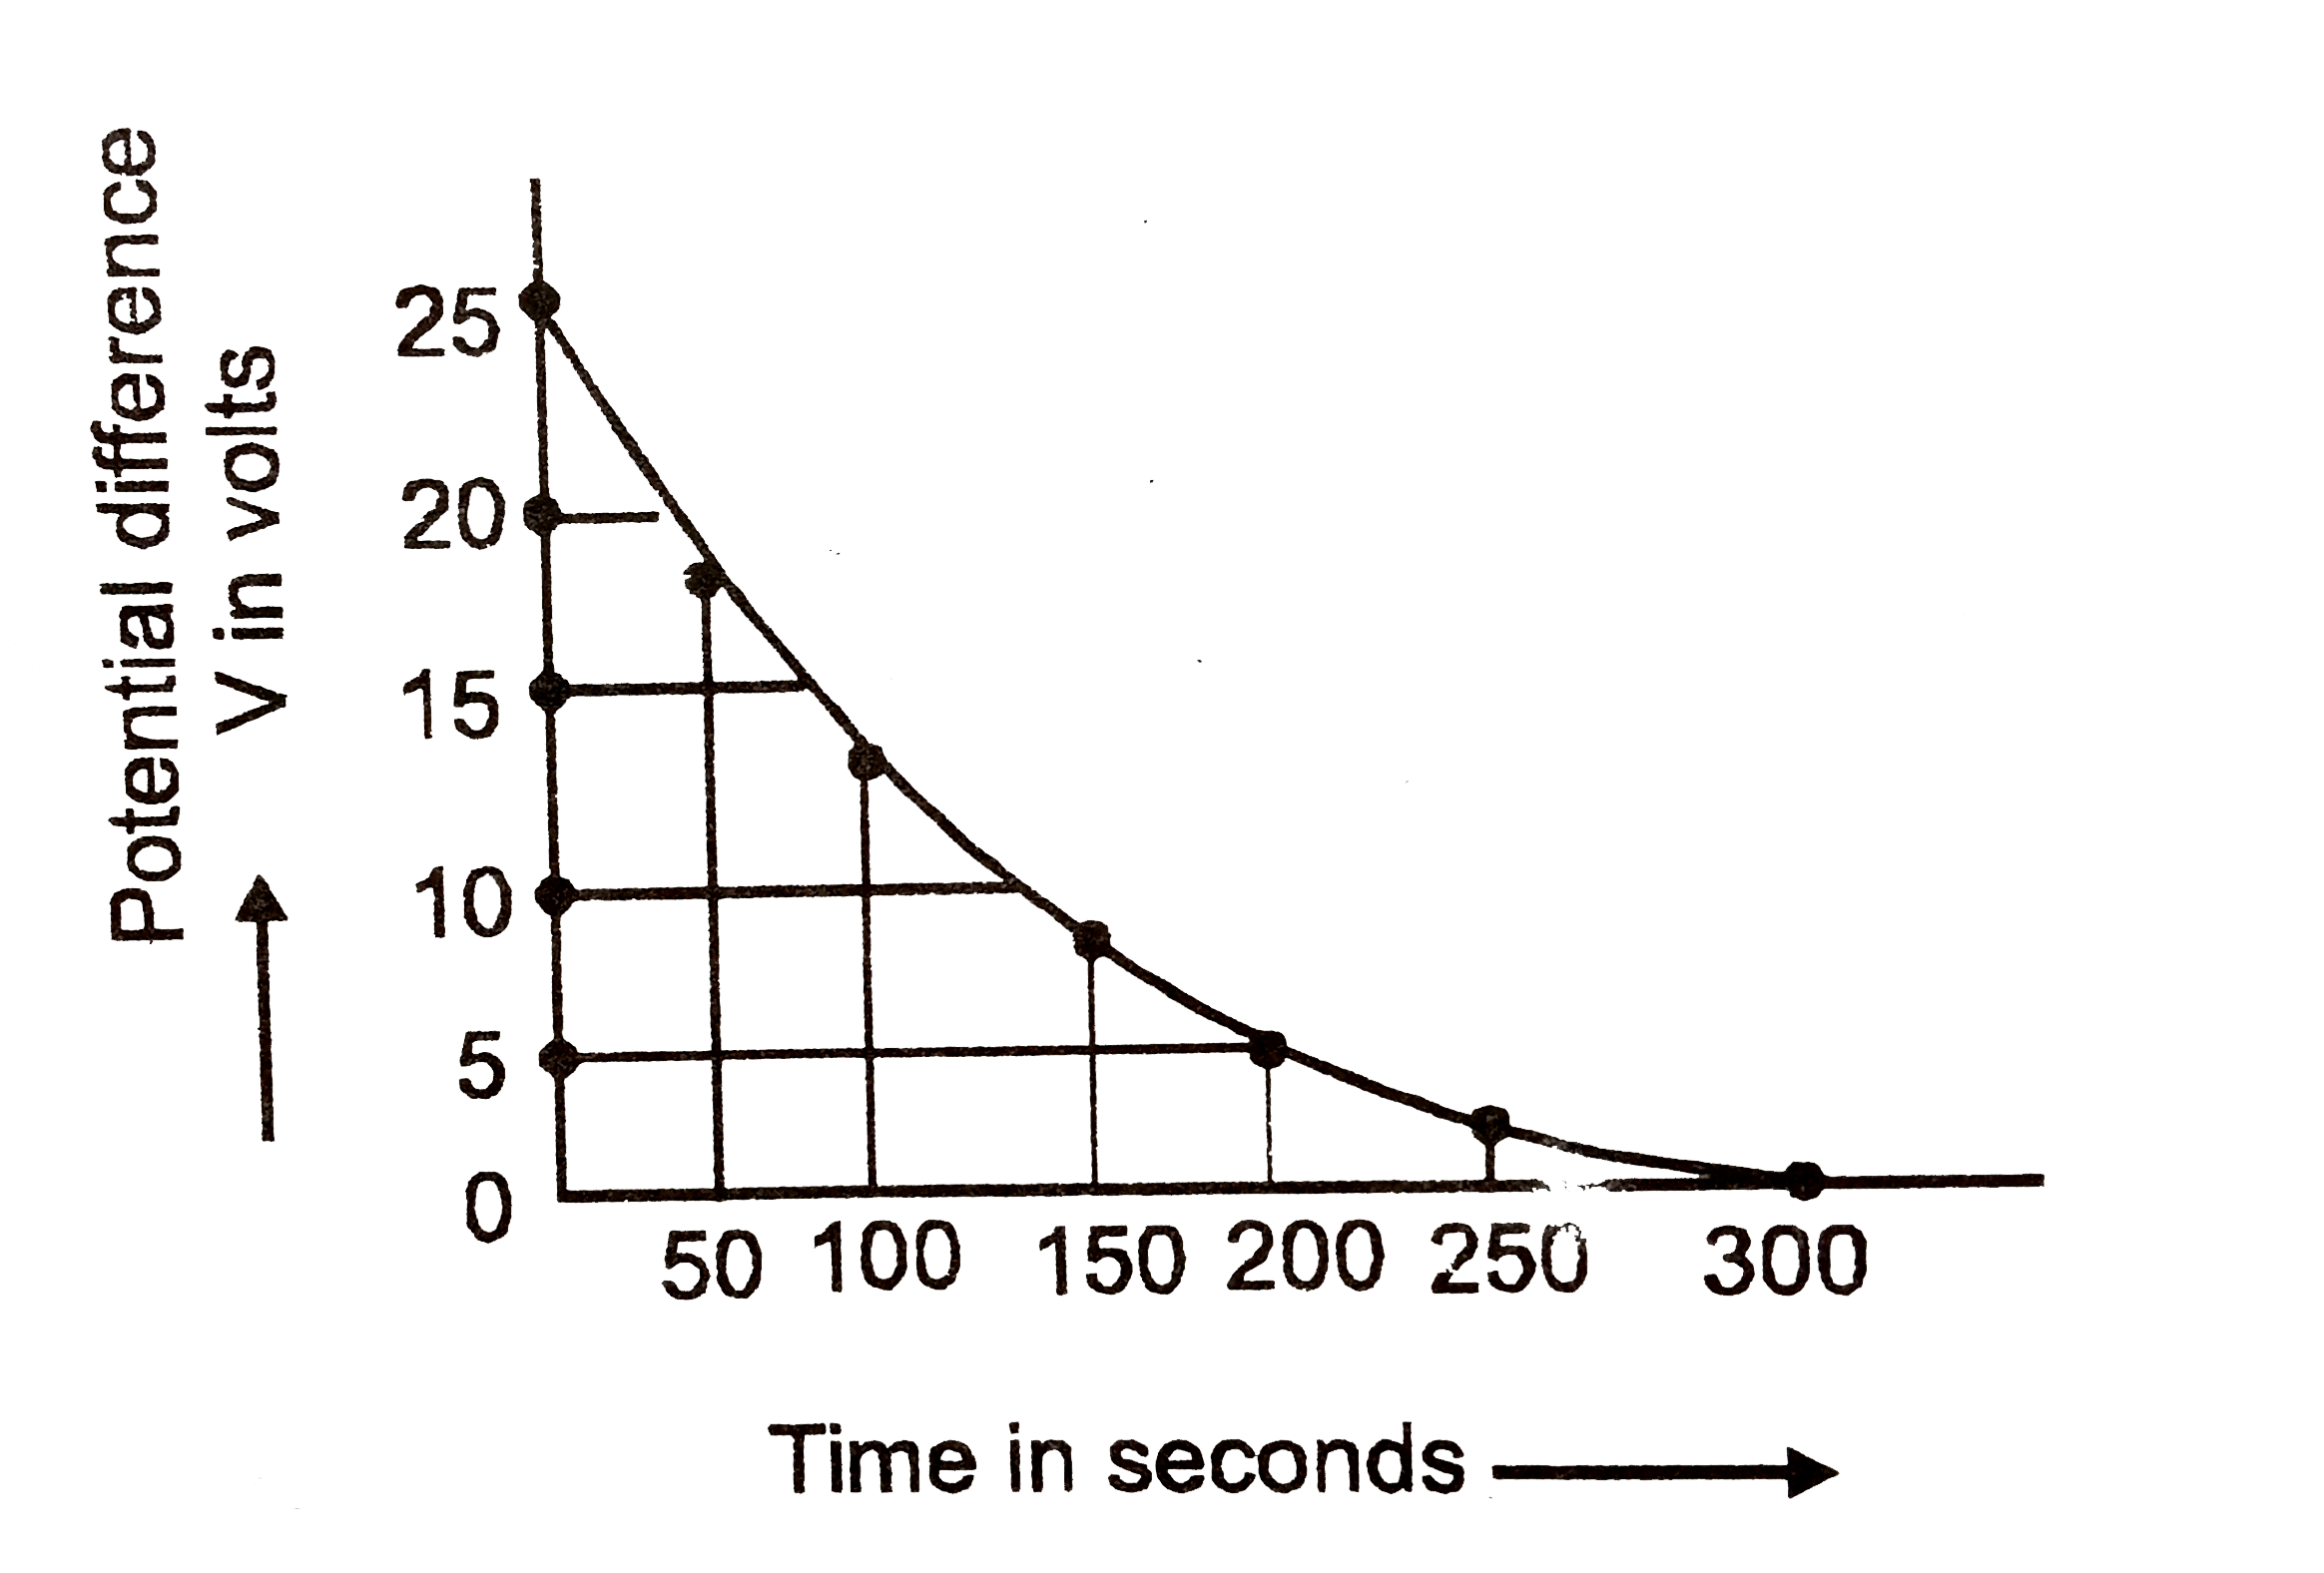
The figure shows an experimental plot discharging of a capacitor in an `RC` circuit. The time constant of this circuit lies between:
A
150 sec and 200 sec
B
0 and 50 sec
C
50 sec and 100 sec
D
100 sec and 150 sec
Text Solution
Verified by Experts
The correct Answer is:
D
Topper's Solved these Questions
JEE MAINS
JEE MAINS PREVIOUS YEAR ENGLISH|Exercise Chemistry|1 Videos
JEE MAIN
JEE MAINS PREVIOUS YEAR ENGLISH|Exercise All Questions|452 Videos
JEE MAINS 2020
JEE MAINS PREVIOUS YEAR ENGLISH|Exercise PHYSICS|250 Videos
Similar Questions
Explore conceptually related problems
The time constant of C-R circuit is
The time constant of the circuit shown is :
Time constant of LR circuit will be
The time constant of L-R circuit is doubled if
The figure shows an L-R circuit the time constant for the circuit is
In the transient circuit shown, the time constant of the circuit is :
The time constant of the circuit shown in the figure is
The value of time constant for the given circuit is
For L-R circuit, the time constant is equal to
A capacitor C is connected to two equal resistances as shown in the figure. Consider the following statemets i. At the time of charging of capacitor time constant of the circuit is CR ii. At the time of discharging of the capacitor the time constant of the circuit is CR iii. At the time of discharging of the capacitor the time constant of the circuit is 2CR iv At the time of charging of the capacitor the time constant of the circuit is 2CR
JEE MAINS PREVIOUS YEAR ENGLISH-JEE MAINS-Chemistry