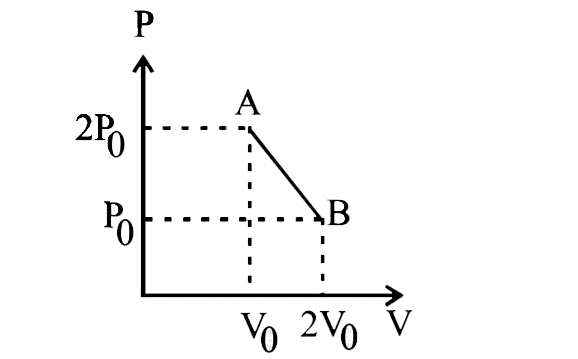
n' moles of an ideal gas undergoes a process `AtoB` as shown in the figure. The maximum temperature of the gas during the process will be:
A
`(3P_(0)V_(0))/(2nR)`
B
`(9P_(0)V_(0))/(2nR)`
C
`(9P_(0)V_(0))/(nR)`
D
`(9P_(0)V_(0))/(4nR)`
Text Solution
Verified by Experts
The correct Answer is:
D
Topper's Solved these Questions
JEE MAINS
JEE MAINS PREVIOUS YEAR ENGLISH|Exercise Chemistry|1 Videos
JEE MAIN
JEE MAINS PREVIOUS YEAR ENGLISH|Exercise All Questions|452 Videos
JEE MAINS 2020
JEE MAINS PREVIOUS YEAR ENGLISH|Exercise PHYSICS|250 Videos
Similar Questions
Explore conceptually related problems
One mole of monoatomic ideal gas undergoes a process ABC as shown in figure. The maximum temperature of the gas during the process ABC is in the form (xPV)/(R) . Find x .
Two moles of a monoatomic ideal gas undergoes a process AB as shown in the figure. Then, find the work done during the process in Joule.
One mole of an ideal monoatomic gas undergoes a cyclic process, as shown in the figure. If the temperature of the gas at state 1 is 300 K and at state 4 is 500 K, then heat exchanged during process 2rarr3 , is
Three moles of an ideal gas undergo a cyclic process shown in figure. The work done by the gas during the process is ["Take ln (2)" = 0.693] A. 2.36 RT_0 B. 0.5RT_0 C. 1.16RT_0 D. -0.58RT_0
One mole of an ideal monotomic gas undergoes a linear process from A to B in which its pressure p and its volume V change as shown in figure. The maximum temperature of the gas during this process is
p-V diagram of an ideal gas for a process ABC is as shown in the figure. (a) Find total heat absorbed or released by the gas during the process ABC. (b) Change in internal energy of the gas during the process ABC. (c) Plot pressure versus density graph of the gas for the process ABC.
0.5 moles of an ideal monoatomic gas undergoes a thermodynamic process from A to B as shown in figure. The change in internal energy of the gas during the process from A to B is
Ideal gas is taken through the process shown in the figure :
Ideal gas is taken through the process shown in the figure :
An ideal gas undergoes the cyclic process shown in a graph below :
JEE MAINS PREVIOUS YEAR ENGLISH-JEE MAINS-Chemistry