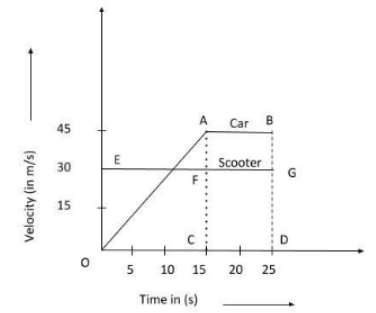
The velocity-time graphsof a car and a scooter are shown in the figure. (i) The difference between the distance travelled by the car and the scooter in 15 and (ii) the time at which the car will catch up with the scooter are, respectively.
A
`225.5 m` and `10 s`
B
`112.5 m` and `15 s`
C
`112.5 m` and `22.5 m`
D
`337.5 m` and `25 s`
Text Solution
Verified by Experts
The correct Answer is:
C
Topper's Solved these Questions
JEE MAINS
JEE MAINS PREVIOUS YEAR ENGLISH|Exercise Chemistry|1 Videos
JEE MAIN
JEE MAINS PREVIOUS YEAR ENGLISH|Exercise All Questions|452 Videos
JEE MAINS 2020
JEE MAINS PREVIOUS YEAR ENGLISH|Exercise PHYSICS|250 Videos
Similar Questions
Explore conceptually related problems
The velocity-time graphs of a car and a scooter are shown in the figure. (i) The difference between the distance travelled by the car and the scooter in 15 s and (ii) the time at which the car will catch up with the scooter are, respectively.
As soon as a car just starts from rest in a certain dercation, a scooter moveing with a uniform speed overtakes the car. Their velocity-time graph is shown in . Calculate . a. The difference between the distances travlled by the car and the scooter in 15 s , b. The distance of car and scooter from the starting point at that instant.
The speed of a car as a function of time is shown in figure. Find the distance travelled by the car in 8 seconds and its acceleration.
The velocity of a car as a function of time is shown in Fig. Find the distance travelled by the car in 8 s and its acceleration.
The velocity-time graph of a car moving along a straight road is shown in figure. The average velocity of the car is first 25 seconds is
The velocity-time graph of a car moving along a straight road is shown in figure. The average velocity of the car in first 25 seconds is
The velocity-time graph of robber's car and a chasing police car are shown in the following graph. Police car crosses the robber's car in time
What will be the closest distance between the cars and also find the time instant at which the distance will be closest? : The distance will be:
The speed-time graph for a car is shown is Figure (a) Find how far does the car travel in the first 4 seconds. Shade the area on the graph that represents the distance travelled by the car during this period. (b) Which part of the graph represents uniform motion of the car ?
The shortest distance between the car and the motorcycle if their initial positions are as shown, will be :
JEE MAINS PREVIOUS YEAR ENGLISH-JEE MAINS-Chemistry