For a simple pendulum, a graph is plotted between itskinetic energy `(KE)` and potential energy `(PE)`against its displacement `d`. Which one of the following represents these correctly? (graph are schematic and not drawn to scale)
For a simple pendulum, a graph is plotted between itskinetic energy `(KE)` and potential energy `(PE)`against its displacement `d`. Which one of the following represents these correctly? (graph are schematic and not drawn to scale)
A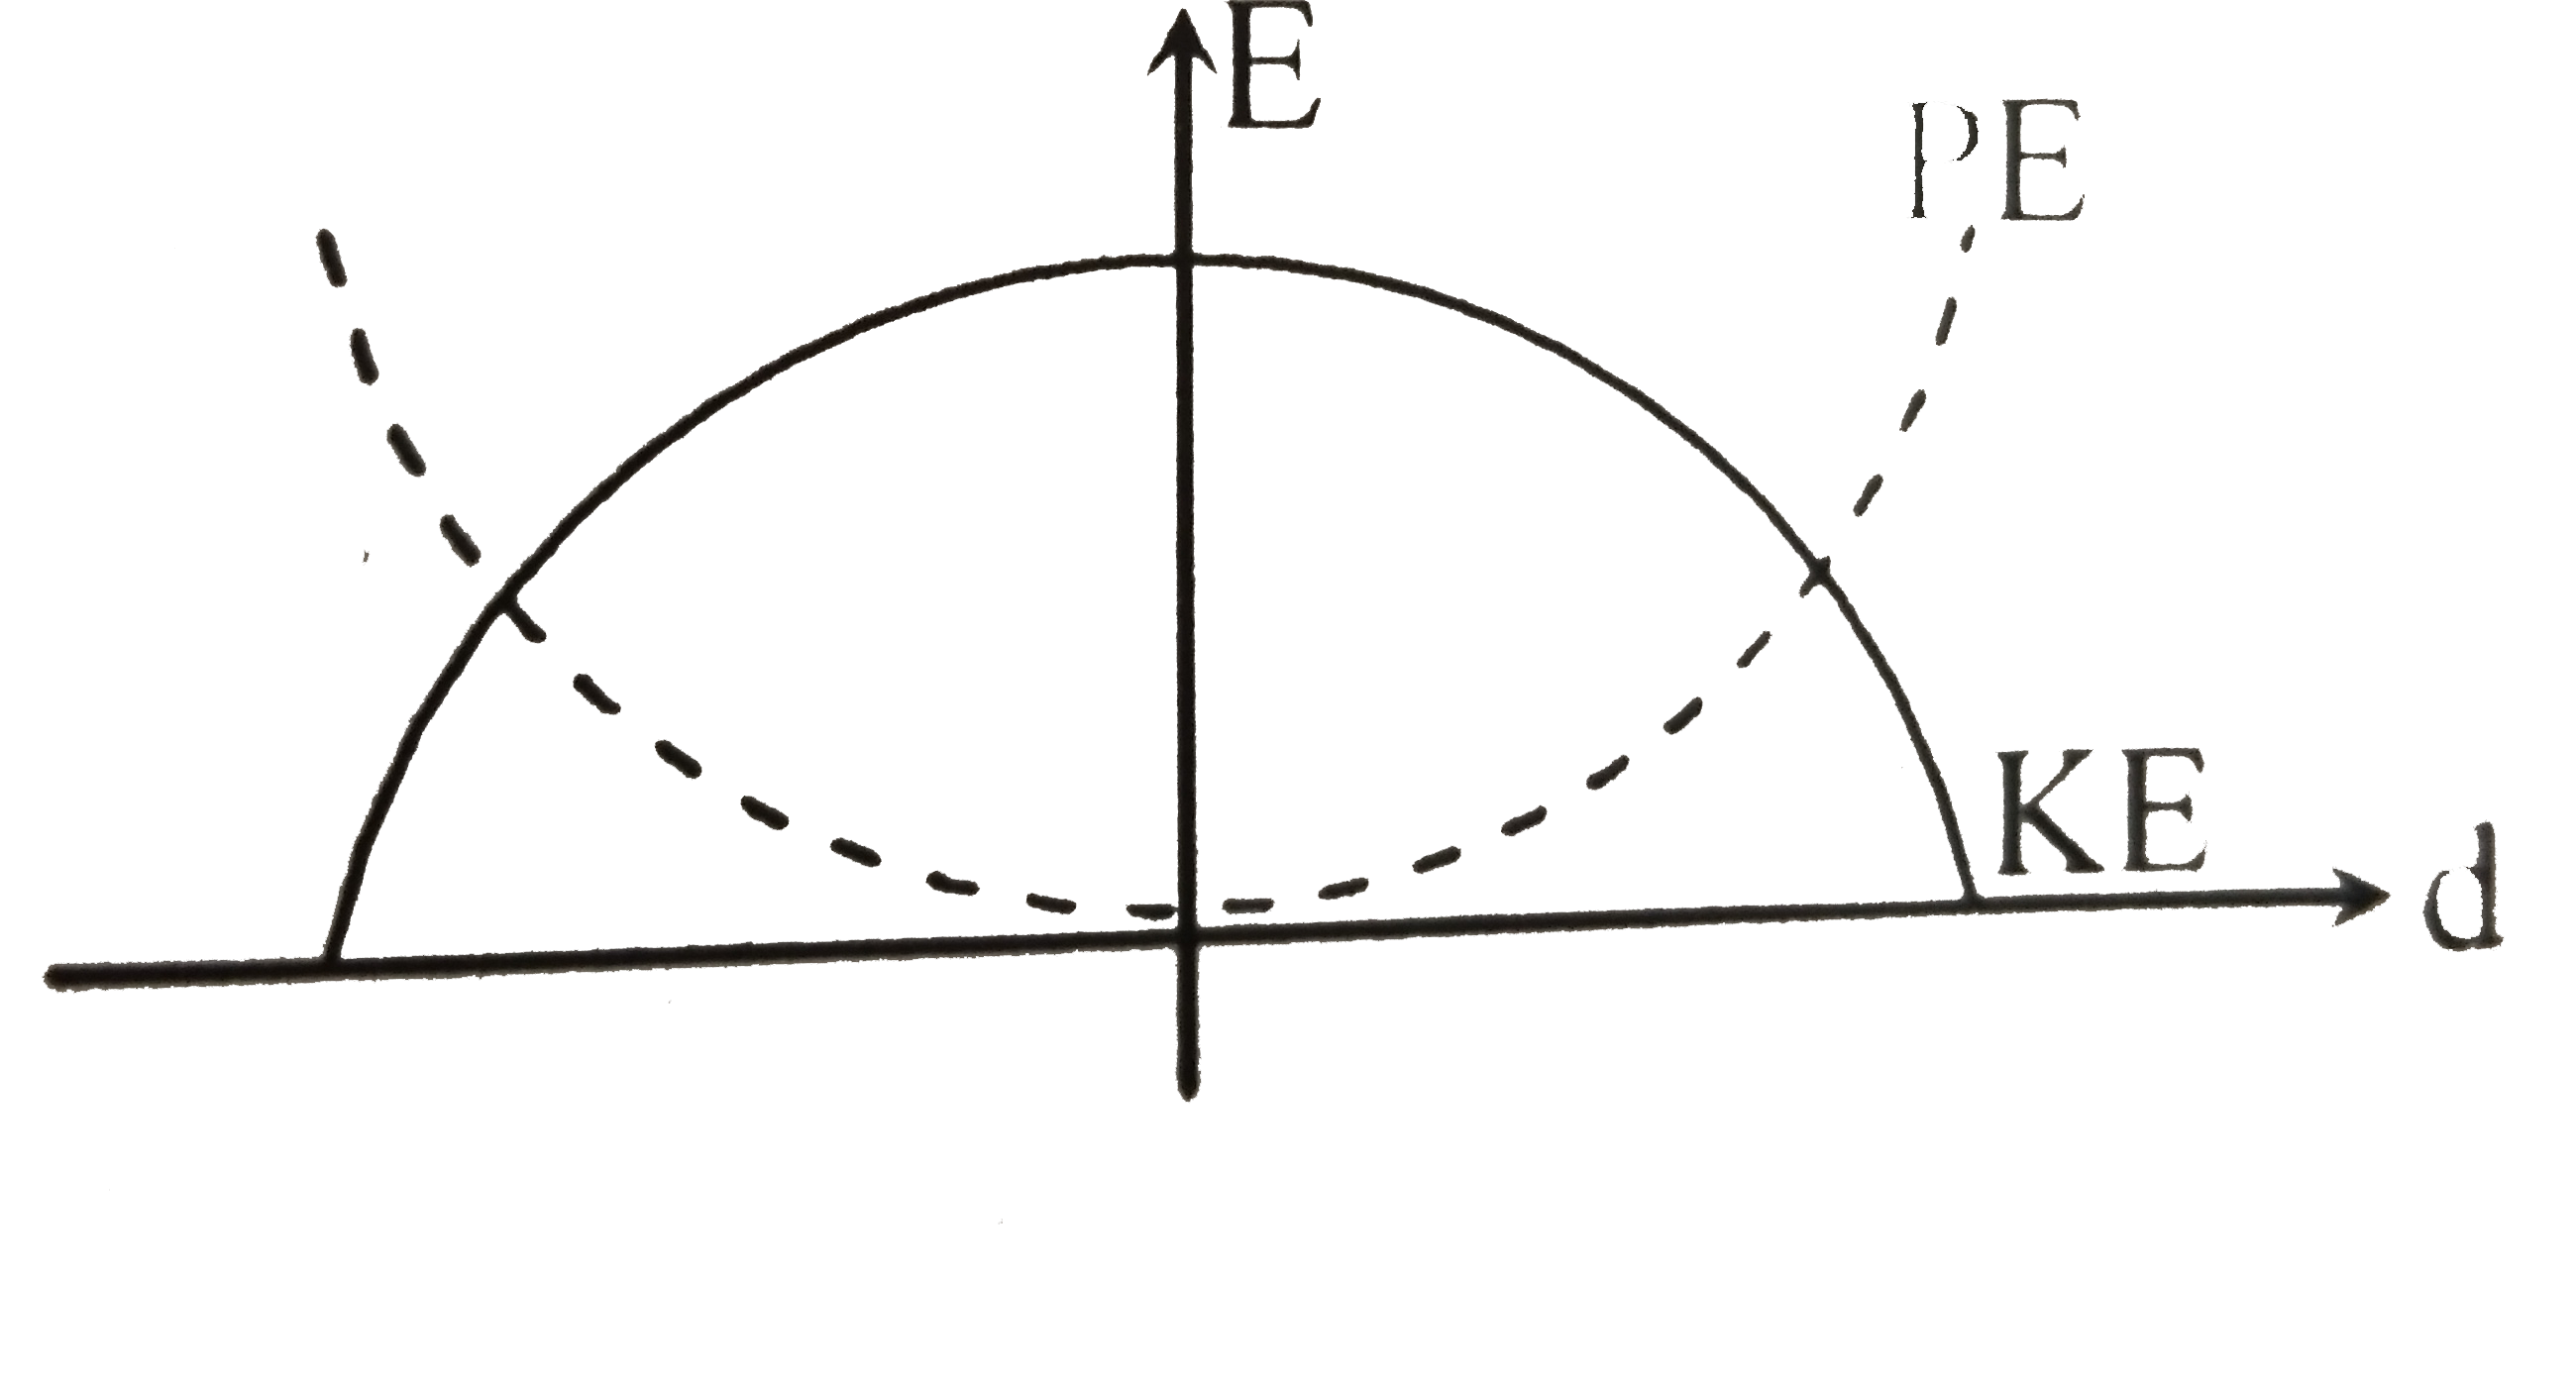
B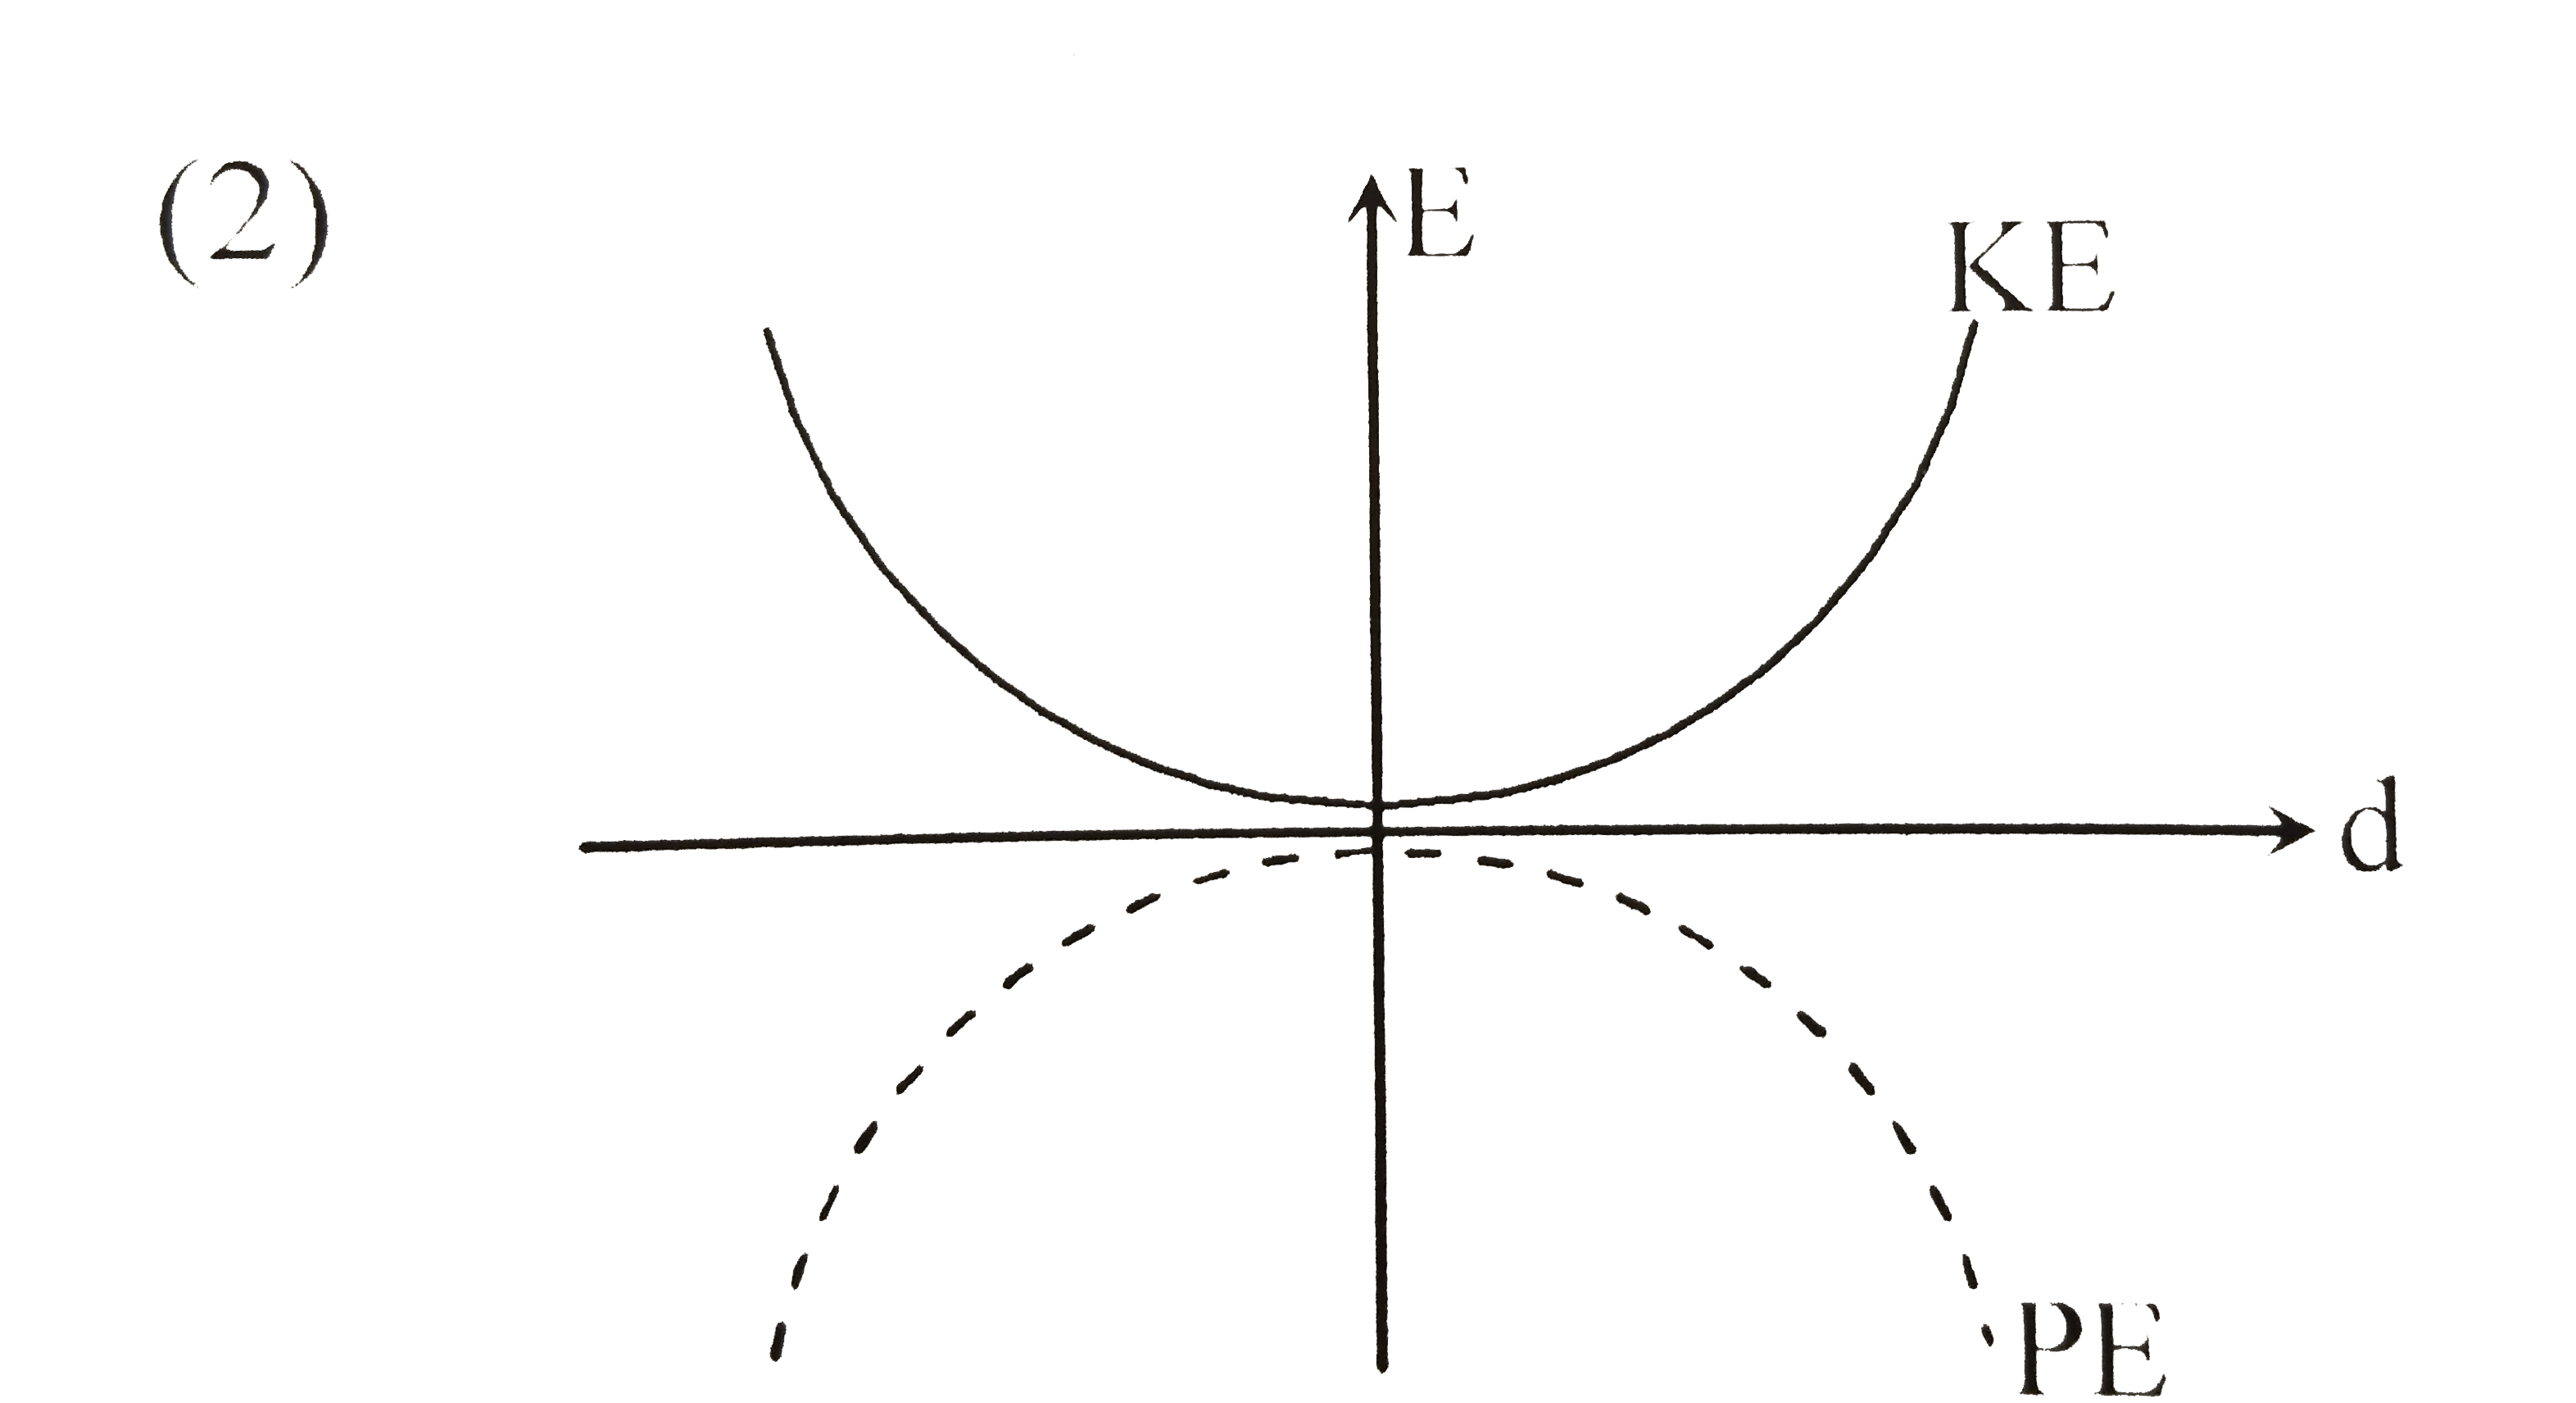
C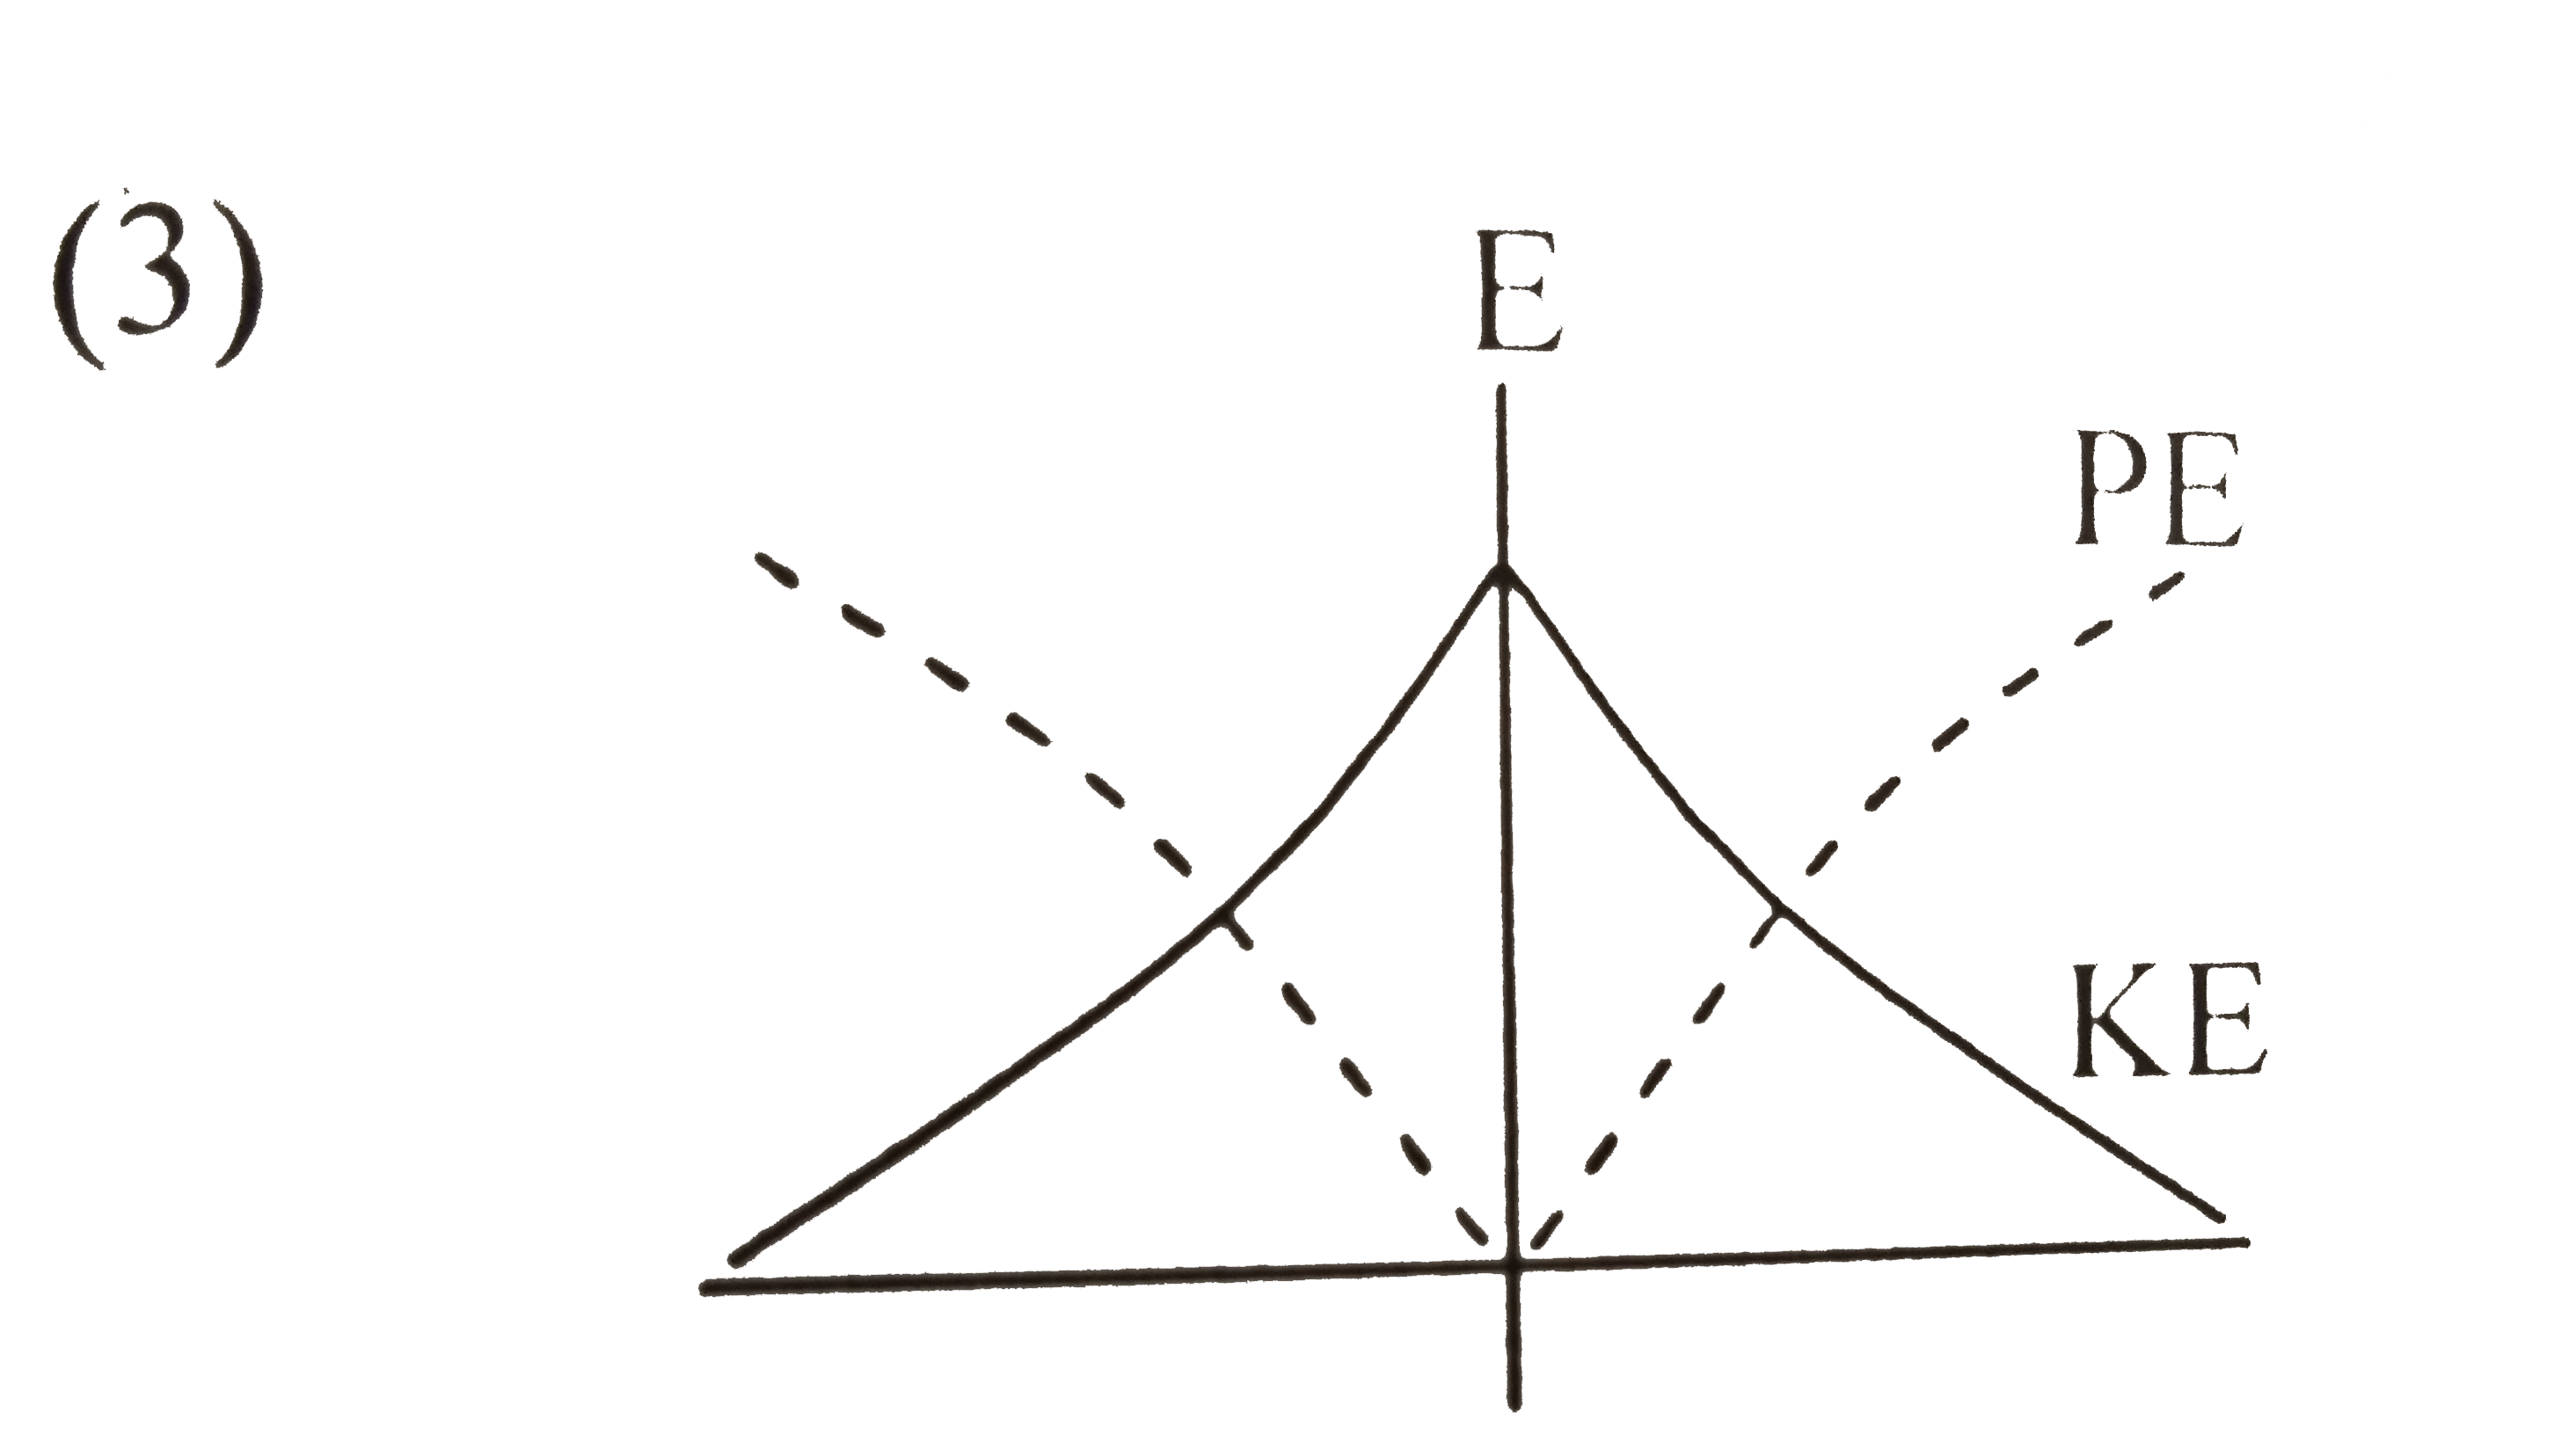
D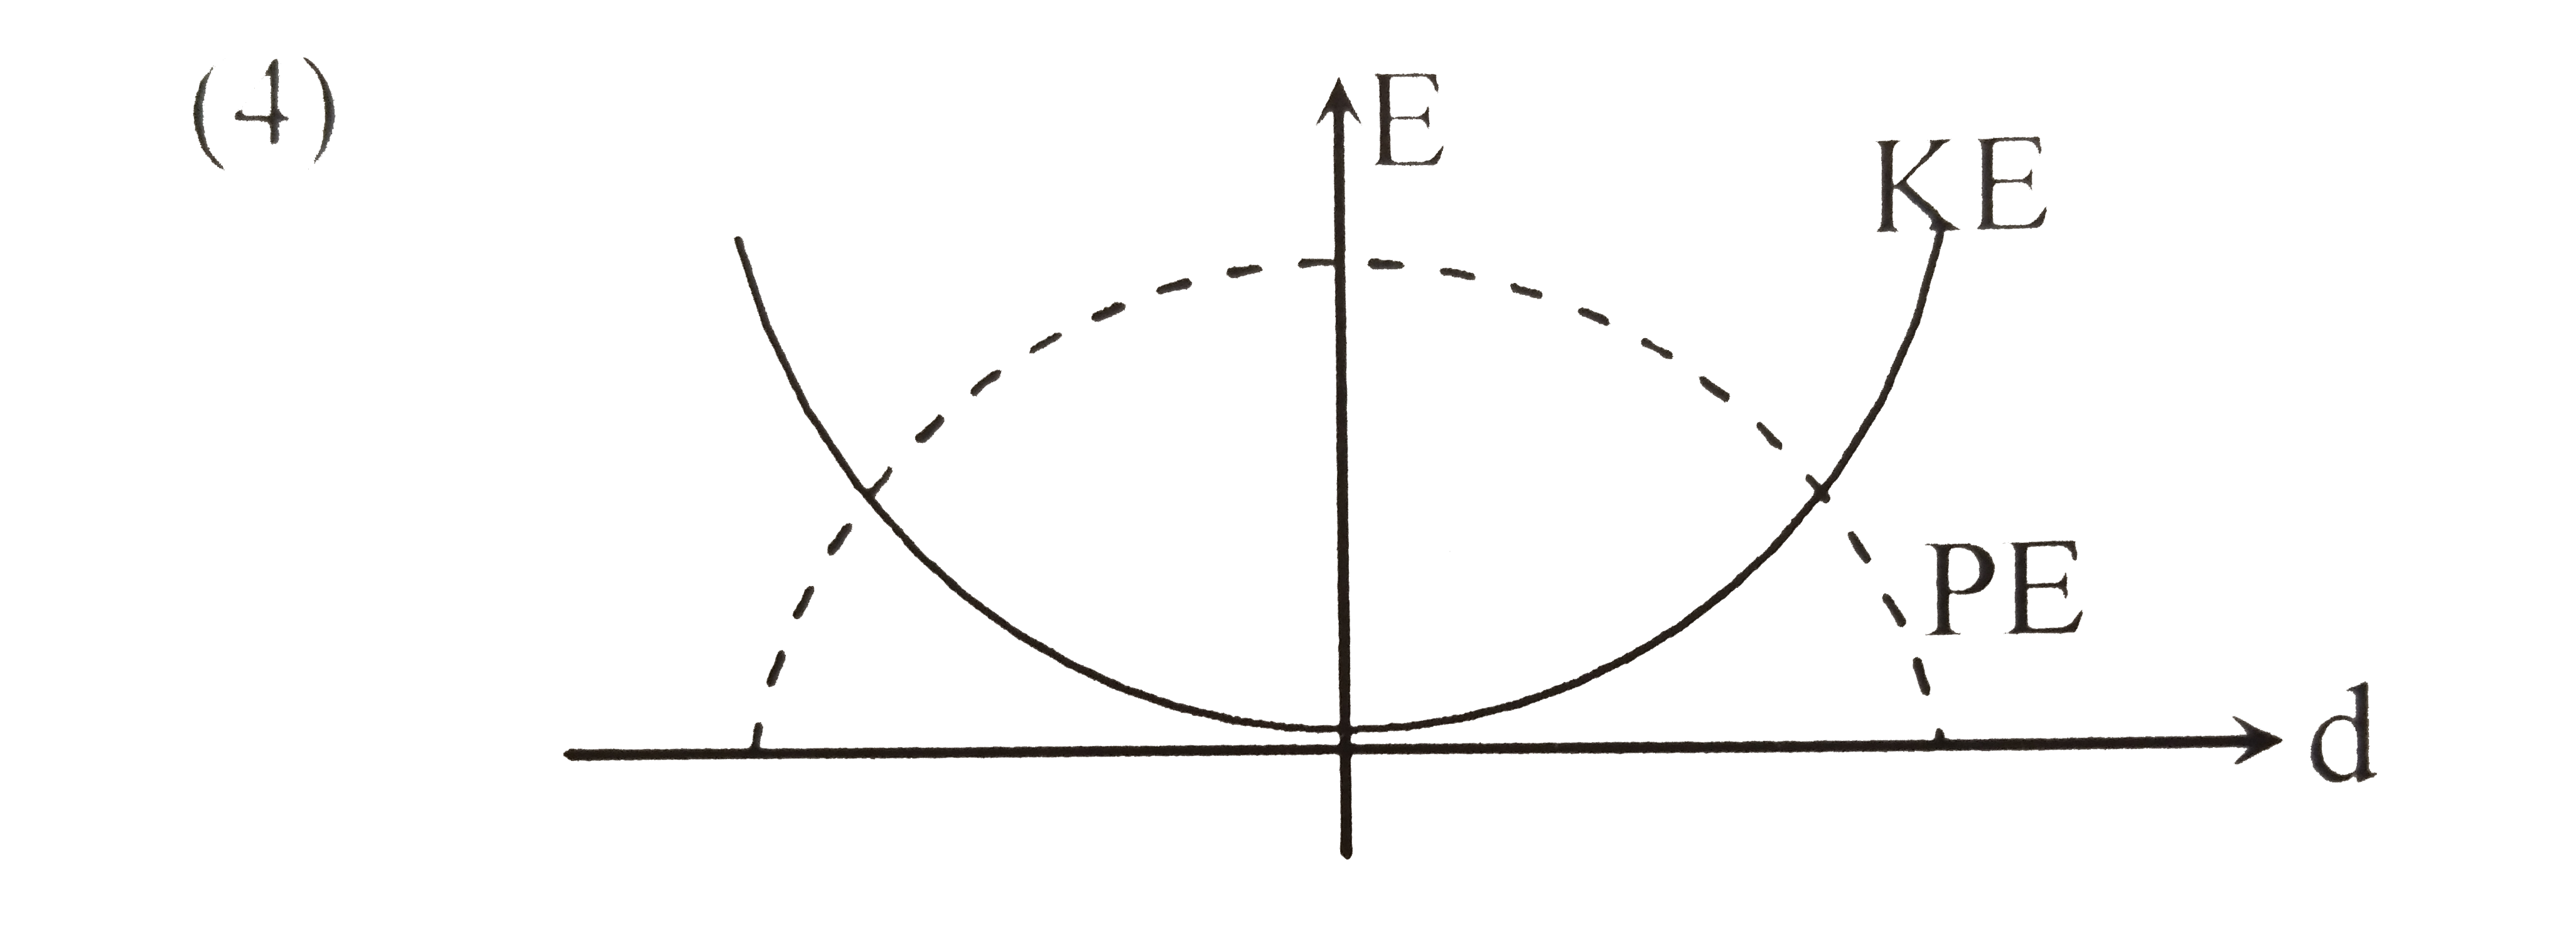
Text Solution
AI Generated Solution
The correct Answer is:
To solve the problem of determining the correct graph representing the relationship between kinetic energy (KE) and potential energy (PE) of a simple pendulum against its displacement (d), we can follow these steps:
### Step 1: Understand the Energy Transformation in a Pendulum
In a simple pendulum, as it swings, energy transforms between kinetic energy and potential energy. At the mean position (the lowest point), the pendulum has maximum kinetic energy and minimum potential energy. Conversely, at the extreme positions (the highest points), the pendulum has maximum potential energy and minimum kinetic energy.
### Step 2: Define the Points of Maximum and Minimum Energy
- **At the mean position (d = 0)**:
- KE is maximum (let's denote it as KE_max).
- PE is minimum (PE = 0).
- **At the extreme positions (d = ±A, where A is the amplitude)**:
- KE is minimum (KE = 0).
- PE is maximum (let's denote it as PE_max).
### Step 3: Analyze the Energy Distribution
As the pendulum moves from the mean position to the extreme position:
- When moving away from the mean position (d increases), KE decreases while PE increases.
- When moving back towards the mean position (d decreases), KE increases while PE decreases.
### Step 4: Graphical Representation
- The graph of KE vs. d will start at a maximum value at d = 0 and decrease to zero at d = ±A.
- The graph of PE vs. d will start at zero at d = 0 and increase to a maximum value at d = ±A.
### Step 5: Identify the Correct Graph
Now, based on the above analysis, we can identify the correct graph:
- The graph of KE should be a downward-opening parabola starting from KE_max at d = 0 and reaching zero at d = ±A.
- The graph of PE should be an upward-opening parabola starting from zero at d = 0 and reaching PE_max at d = ±A.
### Conclusion
The correct option represents the graphs of KE and PE against displacement d, where KE is maximum at the mean position and PE is maximum at the extreme positions.


Topper's Solved these Questions
Similar Questions
Explore conceptually related problems
Which of the following graph is correct between kinetic energy E , potential energy (U) and height (h) from the ground of the partical
A body is thrown vertically upwards. Which one of the following graphs correctly represent the velocity vs time?
A L-C-R circuit is equivalent to a damped pendulum . In an L-C-R circuit the capacitor is charged to underset(o)(Q) and then connected to the L and R as shown below. If a student plots graph of the square of maximum charge on the capacitor with time (t) for two different values underset(1)(L) and underset(2)(L) (underset(1)(L) gt underset(2)(L) of L), then which of the following represents this graph correctly (plots are schematic and not drawn to scale)
The following is a graph plotted between the vapour pressure of two volatile liquids against their respective mole fractions. Which of the following statements is/are correct?
A body executes simple harmonic motion. The potential energy (P.E), the kinetic energy (K.E) and energy (T.E) are measured as a function of displacement x . Which of the following staements is true?
An LCR curcuit is equivalent to a damped pendulum. In an LCR circuit the capacitor is charged to (Q_0) and then connected to the L ans R as shown below. If a student plaots graphs of the square of maximum charge (Q_(max)^(2)) on the capacitor with time (t) for two different values L_(1) and L_(2) (L_(1)gtL_(2)) of L then which of the following represents this graph correclty? (plots are schematic and not drawn to scale).
An LCR curcuit is equivalent to a damped pendulum. In an LCR circuit the capacitor is charged to (Q_0) and then connected to the L ans R as shown below. If a student plaots graphs of the square of maximum charge (Q_(max)^(2)) on the capacitor with time (t) for two different values L_(1) and L_(2) (L_(1)gtL_(2)) of L then which of the following represents this graph correclty? (plots are schematic and not drawn to scale).
Which one of the following diagrams correctly represents the energy levels in the p-type semiconductor?
For the chemical process energies are plotted in graph. Which of the following is correct ?
Which of the following energy-time graphs represents dajmped harmonic oscillator?