


Similar Questions
Explore conceptually related problems
JEE MAINS PREVIOUS YEAR ENGLISH-JEE MAIN-All Questions
- A satellite is revolving around the earth. Ratio of its orbital speed ...
Text Solution
|
- If I is moment of inertia, F is force, v is velocity, E is energy and ...
Text Solution
|
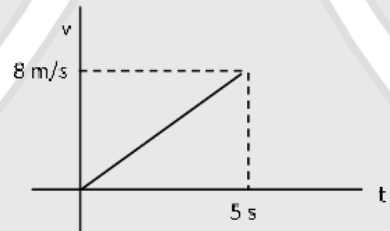
- Speed time graph of a particle shown in figure. Find distance travelle...
Text Solution
|
- In displacement method distance of object and screen is 100 cm initial...
Text Solution
|
- Binding energy per nucleon of .50Sn^120 approximately will be. [ Atomi...
Text Solution
|
- Voltage range of galvanometer of resistance R is 0 to 1V. When its ran...
Text Solution
|
- Find % error in x, where x = (a^2 b^(3/2) )/ (c^(1/2) d^3) and % error...
Text Solution
|
- Acceleration due to gravity is same when an object is at height R/2 fr...
Text Solution
|
- A shell of relative density 27/9 w.r.t water is just submerged in wat...
Text Solution
|
- A helicopter rises from rest on the ground vertically upwards with a c...
Text Solution
|
- Two capacitors of capacitances C and 2C are charged to patential diffe...
Text Solution
|
- A disc with moment of inertia I is rotating with some angular speed. S...
Text Solution
|
- A bullet of mass 5 g travelling with a speed of 210 m/s, strikes a fix...
Text Solution
|
- In photoelectric effect experiment potential difference between plates...
Text Solution
|
- A uniformly charged sphere of charge Q and radius R is placed at some ...
Text Solution
|
- Which of the following graph represents relation between the image pos...
Text Solution
|
- velocity time graph of a particle is shown in figure. Find displacemen...
Text Solution
|
- A light of 4 eV incident on metal surface of work function phi eV . An...
Text Solution
|
- A ring-1 oscillate with period T1 about tangential axis in the plane o...
Text Solution
|
- A car is moving towards a fixed wall, it blows form of frequency of 44...
Text Solution
|