Home
Class 11
PHYSICS
The figure below shows the plot of versu...

The figure below shows the plot of versus P for oxygen gas at two different temperatures Read the following statements concerning the curves given below

i)The dotted line corresponds to the 'ideal' gas behaviour
ii)`T_(1)gtT_(2)`
iii)The value of `(PV)/(nT)` at the point ,where the curves meet on the y-axis is the same for all gases which of the above statement is true?

A

I only

B

I and ii

C

all of these

D

none of these

Text Solution

Verified by Experts

The correct Answer is:
C
Promotional Banner

Topper's Solved these Questions

  • KINETIC THEORY OF GASES

    AAKASH SERIES|Exercise EXERCISE-IB(Theoretical Questions)|29 Videos
  • KINETIC THEORY OF GASES

    AAKASH SERIES|Exercise EXERCISE-2(Kinetic Theory of an ideal gas)|25 Videos
  • KINETIC THEORY OF GASES

    AAKASH SERIES|Exercise EXERCISE-IA (kinetic theory of an ideal a gas)|42 Videos
  • KINEMATICS

    AAKASH SERIES|Exercise ADDITIONAL PRACTICE EXERCISE (PRACTICE SHEET (ADVANCED)) (Integer Type Questions)|12 Videos
  • LAWS OF MOTION

    AAKASH SERIES|Exercise PRACTICE EXERCISE|108 Videos

Similar Questions

Explore conceptually related problems

Figure show plot of (PV)/(T) and P for 2gm of oxygen gas at two different temeratures. (i)The significance of dotted line (ii)The relation between T_(1) and T_(2) (iii)The value of (PV)/(T) where the curves meet on the Y-axis.

Figure Show plot of PV//T versus P for 1.00xx10^(-3) kg of oxygen gas at two different temperatures. (a) What does the dotted plot signify? (b) Which is true: T_(1) gt T_(2) or T_(1) lt T_(2) ? (c) What is the value of PV//T where the curves meet on the y-axis? (d) If we obtained similar plots for 1.00xx10^(-3) kg of hydrogen, would we get the same value of PV//T at the point where the curves meet on the y-axis? If not, what mass of hydrogen yields the same value of PV//T (for low pressure high temperature region of the plot) ? (Molecular mass of H_(2) = 2.02 u, of O_(2) = 32.0 u, R= 8.31Jmol^(-1)K^(-1).)

Figure shows the pressure versus temperature curves for a given mass of a gas corresponding to two different volumes V_1 and V_2 then

Given is the graph between PV/T and P for 1 gm of oxygen gas at two different temperature T_(1) and T_(2) (Given:Density of oxygen= 1.429 kg//m^(3) ).The value of PV/T at the point A and the relation between T_(1) and T_(2) and respectively

Observed the following statements I: The intercepts of the circle x^(2)+y^(2)-4x+13=0 on y-axis is sqrt(7) II: The intercept made by the circle x^(2)+y^(2)-4x-8y+13=0 on x-axis is 15 III: The straight line y=x+1 cuts the circle x^(2)+y^(2)=1 in two, two distinct points, then truness, falseness of the above statements are

The following questions consist of two statements, one labelled as 'Statement I' and the other 'Statement II'. You have to examine these two statements carefully and decide if the Statement I and the Statement II, are individually true and if so, whether the Statement II is the correct explanation for the given Statement I. Select your answer to these items using the codes given below and then select the correct option. Statement-1 : The value of tan^(-1)2+tan^(-1)3=(3pi)/4 Statement-2 : If x gt 0, y gt 0, xy gt 1" then "tan^(-1)x+tan^(-1)y=pi+tan^(-1)((x+y)/(1-xy))

On the basis of the postulates of kinetic theory of gases, it is possible to derive the mathematical expression, commonly known as kinetic gas equation. PV = 1/3 m n u^3? where, P= Pressure of the gas, V a volume of the gas, m=Mass of a molecule, n = Number of molecules present in the given amount of a gas and u = root mean square speed For one mole of gas, PV = RT and n=N_A 1/3 m N_a u^2 = RT or 2/3 .1/2m N_A u^2 = N_A [1/2mN_Au^2 = KE "per mole"] ,2/3K.E. = RT implies K.E. 3/2RT Average kinetic energy per mol does not depend on the nature of the gas but depends only on temperature. This, when two gases are mixed at the same temperature, there will be no rise or decrease in temperature unless both react chemically. Average kinetic energy per molecule = ("Average K.E. per mole")/N = 3/2(RT)/(N) implies 3/2kT where k is the Boltzmann constant Which of the following expressions correctly represents the relationship between the average molar kinetic energies of CO and N_2 molecules at the same temperature ?

AAKASH SERIES-KINETIC THEORY OF GASES-EXERCISE-IA(Degree of Freedom)
  1. The molar specific heat for solid is

    Text Solution

    |

  2. The molar specific heat for water molecules

    Text Solution

    |

  3. Experimental values of specific heats are usually more than predict va...

    Text Solution

    |

  4. Graph of specific heat at constant volume for a monoatomic gas as a fu...

    Text Solution

    |

  5. For Boyles law to hold good the gas should be

    Text Solution

    |

  6. If the pressure in a closed vessel is reduced by drawing out some gas,...

    Text Solution

    |

  7. The expression of mean free path, if we consider that only one molecul...

    Text Solution

    |

  8. If we consider the motion of all the molecules, the expression of mean...

    Text Solution

    |

  9. A perfect gas is contained in a cylinder kept in vacuum. If the cylind...

    Text Solution

    |

  10. The rate of diffusion, is

    Text Solution

    |

  11. By kinetic theory, we can measure

    Text Solution

    |

  12. Two balloons are filled, one with pure He gas and other with air, resp...

    Text Solution

    |

  13. According to kinetic theory of gases, molecules of a gas behave like

    Text Solution

    |

  14. The amount of heat energy required to raise the temperature of 1 g of ...

    Text Solution

    |

  15. Kinetic theory of gases is based on the

    Text Solution

    |

  16. At ordinary pressure and temperature the average distance between the ...

    Text Solution

    |

  17. While deriving the expression of the pressure of a ideal gas,

    Text Solution

    |

  18. When an ideal gas is compressed adiabatically, its temperature rises, ...

    Text Solution

    |

  19. According to Dalton's law of partial pressure

    Text Solution

    |

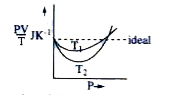
  20. The figure below shows the plot of versus P for oxygen gas at two diff...

    Text Solution

    |