Text Solution
Verified by Experts


Topper's Solved these Questions
MOTION IN A STRAIGHT LINE
AAKASH SERIES|Exercise Problems Based On Calculus|28 VideosMOTION IN A STRAIGHT LINE
AAKASH SERIES|Exercise Exercise 1A|62 VideosMOTION IN A PLANE
AAKASH SERIES|Exercise Practice Exercise|84 VideosNEWTONS LAWS OF MOTION
AAKASH SERIES|Exercise ADDITIONAL PRACTICE EXERCISE PRACTICE SHEET (ADVANECED) (Matrix Matching Type Questions)|1 Videos
AAKASH SERIES-MOTION IN A STRAIGHT LINE-Questions for Descriptive Answers
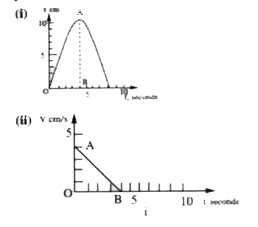
- The graphs in (i) and (ii) show the S-t graph and V -t graph of a body...
Text Solution
|
- Three tortoises are located at the vertices of an equilateral triangle...
Text Solution
|
- A particle moves so that its position vector varies with time as vecr=...
Text Solution
|
- A train stopping at two stations 4km apart 4 minutes on the journey fr...
Text Solution
|
- The accelerating of particle varies with time as shown (a)Find an e...
Text Solution
|
- A rocket is moving in a gravity free space with a constant acceleratio...
Text Solution
|
- From a tower of height H, a particle is thrown vertically up with a sp...
Text Solution
|
- A particle starts from rest .its acceleration a versus time t is as sh...
Text Solution
|