


Similar Questions
Explore conceptually related problems
Recommended Questions
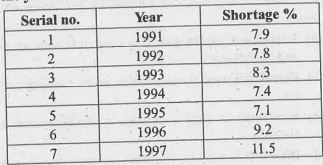
- The following table shows the total power shortage in India from 1991-...
Text Solution
|
- What is the total population for the year 1997?
Text Solution
|
- निम्नलिखित सारणी किसी अस्पताल में एक विशेष वर्ष में भर्ती हुए रोगियों ...
Text Solution
|
- 2.WHICH OF THE FOLLOWING DOES NOT SHOW WATER SHORTAGE?
Text Solution
|
- 2.WHICH OF THE FOLLOWING DOES NOT SHOW WATER SHORTAGE?
Text Solution
|
- 2.WHICH OF THE FOLLOWING DOES NOT SHOW WATER SHORTAGE?
Text Solution
|
- भारत में वर्ष 1951, 1961, 1966, 1969, 1970 में नागरिकों को दिए गए अनुद...
Text Solution
|
- निम्नलिखित सारणी में 1991 से 1997 तक भारत में विधुत की कुल कमी को दिखा...
Text Solution
|
- The following table shows the total power shortage percentage in India...
Text Solution
|