


Topper's Solved these Questions
Similar Questions
Explore conceptually related problems
MBD-MOTION-Example
- A driver of a car travelling at 52kmh^(-1) applies the brake and acce...
Text Solution
|
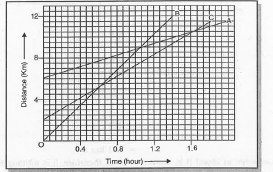
- Fig 1.11 show the distance - time graphs of three A,B and C. Study th...
Text Solution
|
- Fig 1.11 show the distance - time graphs of three A,B and C. Study th...
Text Solution
|
- Fig 1.11 show the distance - time graphs of three A,B and C. Study th...
Text Solution
|
- Fig 1.11 show the distance - time graphs of three A,B and C. Study th...
Text Solution
|
- A ball is gently dropped from a height of 20 m. If its velocity increa...
Text Solution
|
- Speed - time graph for a car is show in the fig 1.13: Find how far the...
Text Solution
|
- Speed - time graph for a car is show in the fig 1.13:Which part of the...
Text Solution
|
- State which of the following situations are possible and give an examp...
Text Solution
|
- State which of the following situations are possible and give an examp...
Text Solution
|
- An artificial satellite is moving in a circular path orbit of radius 4...
Text Solution
|
- Derive mathematically the equations of motion.
Text Solution
|
- For uniform accelerated motion, draw by graphical method establish the...
Text Solution
|
- For uniform accelerated motion, draw by graphical method establish the...
Text Solution
|
- For uniform accelerated motion, draw by graphical method establish the...
Text Solution
|
- Draw velocity-time graph for a body moving with uniform velocity. Henc...
Text Solution
|
- What is meant by Angular velocity ? How is it related to linear veloci...
Text Solution
|
- Define rest and motion. Give one example for each.
Text Solution
|
- Show that rest and motion are relative terms.
Text Solution
|
- Give some points of differences between distance and displacement.
Text Solution
|