Text Solution
Verified by Experts
The correct Answer is:


Topper's Solved these Questions
PROBABILITY
NAVNEET PUBLICATION - MAHARASHTRA BOARD|Exercise Multiple Choice Questions (MCQs)|10 VideosPROBABILITY
NAVNEET PUBLICATION - MAHARASHTRA BOARD|Exercise Skill Testing Exercise|8 VideosLINE AND ANGLES
NAVNEET PUBLICATION - MAHARASHTRA BOARD|Exercise Multiple Choice Questions MCQs)|10 VideosSURFACE AREAS AND VOLUMES
NAVNEET PUBLICATION - MAHARASHTRA BOARD|Exercise MULTIPLE CHOICE QUESTIONS|18 Videos
Similar Questions
Explore conceptually related problems
NAVNEET PUBLICATION - MAHARASHTRA BOARD-PROBABILITY -EXERCISE 15.1
- 1500 families with 2 children were selected randomly , and the followi...
Text Solution
|
- Refer to Example 5, Section 14.4, Chapter 14. Find the probability ...
Text Solution
|
- Three coins are tossed simultaneously 200 times with the following fre...
Text Solution
|
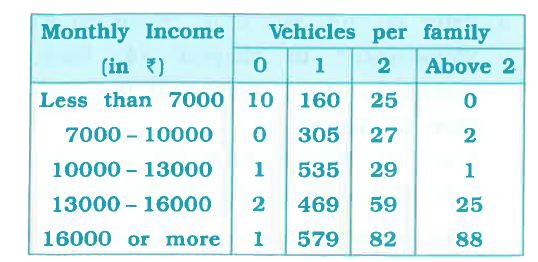
- An organisation selected 2400 families at random and surveyed them to ...
Text Solution
|
- An organisation selected 2400 families at random and surveyed them to ...
Text Solution
|
- An organisation selected 2400 families at random and surveyed them to ...
Text Solution
|
- An organisation selected 2400 families at random and surveyed them to ...
Text Solution
|
- An organisation selected 2400 families at random and surveyed them to ...
Text Solution
|
- A teacher analyses the performance of two sections of students in a ma...
Text Solution
|
- Find the probability that a student obtained marks 60 or above.
Text Solution
|
- To know the opinion of the students about the subject statistics , a s...
Text Solution
|
- To know the opinion of the students about the subject statistics , a s...
Text Solution
|
- Refer to Q.2, Exercise 14.2. What is the empirical probability that a...
Text Solution
|
- Refer to Q.2, Exercise 14.2. What is the empirical probability that a...
Text Solution
|
- Refer to Q.2, Exercise 14.2. What is the empirical probability that a...
Text Solution
|
- Activity : Note the frequency of two - wheelers , three - wheelers and...
Text Solution
|
- Activity: Ask all the students in your class to write a 3-digit number...
Text Solution
|
- Eleven bags of wheat flour, each marked 5 kg, actually contained the f...
Text Solution
|
- In sum you were asked to prepare a frequency distribution table, rega...
Text Solution
|
- In Q.1, Exercise 14.2, you were asked to prepare a frequency distri...
Text Solution
|