A
B
C
D
Text Solution
Verified by Experts
The correct Answer is:


Topper's Solved these Questions
THERMODYNAMICS
AAKASH SERIES|Exercise LECTURE SHEET (EXERCISE - II (MORE THAN ONE CORRECT ANSWER TYPE QUESTIONS))|5 VideosTHERMODYNAMICS
AAKASH SERIES|Exercise LECTURE SHEET (EXERCISE - II (LINKED COMPREHENSION TYPE QUESTIONS))|6 VideosTHERMODYNAMICS
AAKASH SERIES|Exercise LECTURE SHEET (EXERCISE - I (INTEGER TYPE QUESTIONS))|4 VideosTHERMAL PROPERTIES OF MATTER
AAKASH SERIES|Exercise ADDITIONAL PRACTICE EXERCISE (LEVEL - II) PRACTICE SHEET (ADVANCED) Integer/Subjective Type Questions|2 VideosTHERMOMETRY
AAKASH SERIES|Exercise Numerical Exercise (LEVEL- 1)|11 Videos
Similar Questions
Explore conceptually related problems
AAKASH SERIES-THERMODYNAMICS-LECTURE SHEET (EXERCISE - II (STRAIGHT OBJECTIVE TYPE QUESTIONS))
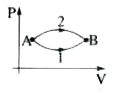
- The figure shows two paths for the change of state of a gas from A to ...
Text Solution
|
- One mole of a monoatomic ideal gas undergoes the process A to B in the...
Text Solution
|
- Monoatomic, diatomic and triatomic gases whose initial volume and pres...
Text Solution
|
- P-V diagram of a diatomic gas is a straight line passing through orig...
Text Solution
|
- Find the molar heat capacity in a process of a diatomic gas if it does...
Text Solution
|
- If 3 moles of a monoatomic gas is mixed with 6 moles of a diatomic gas...
Text Solution
|
- An ideal diatomic gas for which molar heat capacity at constant volume...
Text Solution
|
- N moles of an ideal diatomic gas is contained in a cylinder at tempera...
Text Solution
|
- If Cv for an ideal gas is given by Cv = 3+2T , where T is the absolut...
Text Solution
|
- Two cylinders A and B fitted with pistons contain equal amounts of an ...
Text Solution
|