


Similar Questions
Explore conceptually related problems
Recommended Questions
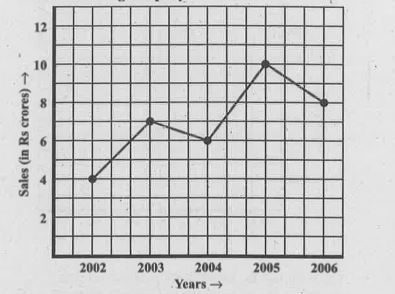
- The following line graph shows the yearly sales figures for a manufact...
Text Solution
|
- The following line graph shows the yearly sales figures for a manufac...
Text Solution
|
- The following article shows the sales of a manufacturing company in di...
Text Solution
|
- The following line graph shows the yearly sales figures for a manufac...
Text Solution
|
- The following line graph shows the yearly sales figures for a manufact...
Text Solution
|
- The following line graph shows the yearly sales figures for a manufact...
Text Solution
|
- The following line graph shows the yearly sales figures for a manufact...
Text Solution
|
- The following line graph shows the yearly sales figures for a manufact...
Text Solution
|
- The following line graph shows the yearly sales figures for a manufact...
Text Solution
|