


Topper's Solved these Questions
STATISTICS
KUMAR PRAKASHAN|Exercise EXERCISE 14.4|6 VideosSTATISTICS
KUMAR PRAKASHAN|Exercise SUM TO ENRICH REMEMBER|14 VideosSTATISTICS
KUMAR PRAKASHAN|Exercise EXERCISE 14.2|9 VideosQUESTION PAPER 3 : FOR THE ANNUAL EXAMINATION
KUMAR PRAKASHAN|Exercise SECTION -D|5 VideosSURFACE AREAS AND VOLUMES
KUMAR PRAKASHAN|Exercise MULTIPLE CHOICE QUESTIONS|18 Videos
Similar Questions
Explore conceptually related problems
KUMAR PRAKASHAN-STATISTICS-EXERCISE 14.3
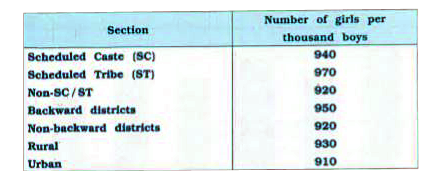
- The following data on the number of girls (to the nearest ten) per tho...
Text Solution
|
- The following data on the number of girls (to the nearest ten) per tho...
Text Solution
|
- Given below are the seats won by different political parties in the po...
Text Solution
|
- 100 surnames were randomly picked up from a local telephone directory ...
Text Solution
|
- The following table gives the distribution of the lifetime of 400 neo...
Text Solution
|
- The runs scored by two teams A and B on the first 60 balls in a cricke...
Text Solution
|
- The following table gives the information about the number of students...
Text Solution
|
- 100 surnames were randomly picked up from a local telephone directory ...
Text Solution
|
- In a city, the weekly observations made in a study on the cost of livi...
Text Solution
|