Text Solution
Verified by Experts
The correct Answer is:


Topper's Solved these Questions
PROBABILITY
KUMAR PRAKASHAN|Exercise Multiple Choice Questions (MCQs)|10 VideosPROBABILITY
KUMAR PRAKASHAN|Exercise Skill Testing Exercise|8 VideosPOLYNOMIALS
KUMAR PRAKASHAN|Exercise Multiple Choice Questions (MCQs)|20 VideosQUADRILATERALS
KUMAR PRAKASHAN|Exercise MULTIPLE CHOICE QUESTION(MCQs)|15 Videos
Similar Questions
Explore conceptually related problems
KUMAR PRAKASHAN-PROBABILITY -EXERCISE 15.1
- 1500 families with 2 children were selected randomly , and the followi...
Text Solution
|
- The following table given the marks scored by 50 students in a 100 mar...
Text Solution
|
- Three coins are tossed simultaneously 200 times with the following fre...
Text Solution
|
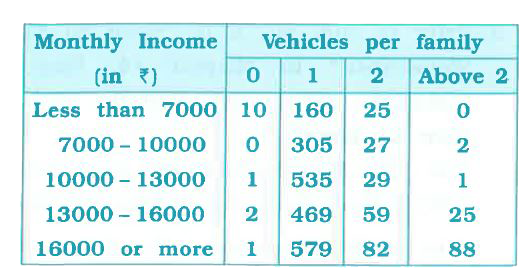
- An organisation selected 2400 families at random and surveyed them to ...
Text Solution
|
- An organisation selected 2400 families at random and surveyed them to ...
Text Solution
|
- An organisation selected 2400 families at random and surveyed them to ...
Text Solution
|
- An organisation selected 2400 families at random and surveyed them to ...
Text Solution
|
- An organisation selected 2400 families at random and surveyed them to ...
Text Solution
|
- Find the probability that a student obtained marks 60 or above.
Text Solution
|
- The following table given the marks scored by 50 students in a 100 mar...
Text Solution
|
- To know the opinion of the students about the subject statistics , a s...
Text Solution
|
- To know the opinion of the students about the subject statistics , a s...
Text Solution
|
- What is the empirical probability that an engineer lives : within 1...
Text Solution
|
- What is the empirical probability that an engineer lives : within 1...
Text Solution
|
- Find the probability that a number selected at random from 1 to 100 is...
Text Solution
|
- 5 girls and 10 boys sit at random in a row having 15 chairs numbered a...
Text Solution
|
- Out of 3n consecutive integers, three are selected at random. Find t...
Text Solution
|
- Eleven bags of wheat flour, each marked 5 kg, actually contained the f...
Text Solution
|
- In sum you were asked to prepare a frequency distribution table, rega...
Text Solution
|
- Everyone should have knowledge about his/her blood group as well as th...
Text Solution
|