Text Solution
Verified by Experts


Similar Questions
Explore conceptually related problems
Recommended Questions
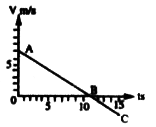
- Velocity-time graph for the motion of a certain body is shown in Fig. ...
Text Solution
|
- The displacement-time graph of a body is shown in. . The velocity-...
Text Solution
|
- If velocity-time graph of a body is as shown in figure, what is the na...
Text Solution
|
- Velocity-time graph for the motion of a certain body is shown in fig. ...
Text Solution
|
- What is the nature of the displacement-time graph of a body moving wit...
Text Solution
|
- The velocity time graph of a body moving along a straight line is show...
Text Solution
|
- Velocity-time graph for the motion of a certain body is shown in Fig. ...
Text Solution
|
- The velocity-time graph of a body moving in a straight line is shown i...
Text Solution
|
- Velocity-time graph for the motion of a certain body is shown in Fig. ...
Text Solution
|