A
B
C
D
Text Solution
Verified by Experts
The correct Answer is:


Topper's Solved these Questions
PLANT GROWTH AND DEVELOPMENT
NCERT FINGERTIPS ENGLISH|Exercise Plant growth regulators|70 VideosPLANT GROWTH AND DEVELOPMENT
NCERT FINGERTIPS ENGLISH|Exercise Photoperiosim|8 VideosPHOTOSYNTHESIS IN HIGHER PLANTS
NCERT FINGERTIPS ENGLISH|Exercise Photosynthesis In Higher Plants|136 VideosPLANT KINGDOM
NCERT FINGERTIPS ENGLISH|Exercise Plant Kingdom|160 Videos
Similar Questions
Explore conceptually related problems
NCERT FINGERTIPS ENGLISH-PLANT GROWTH AND DEVELOPMENT-Plant Growth And Development
- The given figure shows development of an embryo that undergoes two pha...
Text Solution
|
- The exponential growth can be mathematically expressed as
Text Solution
|
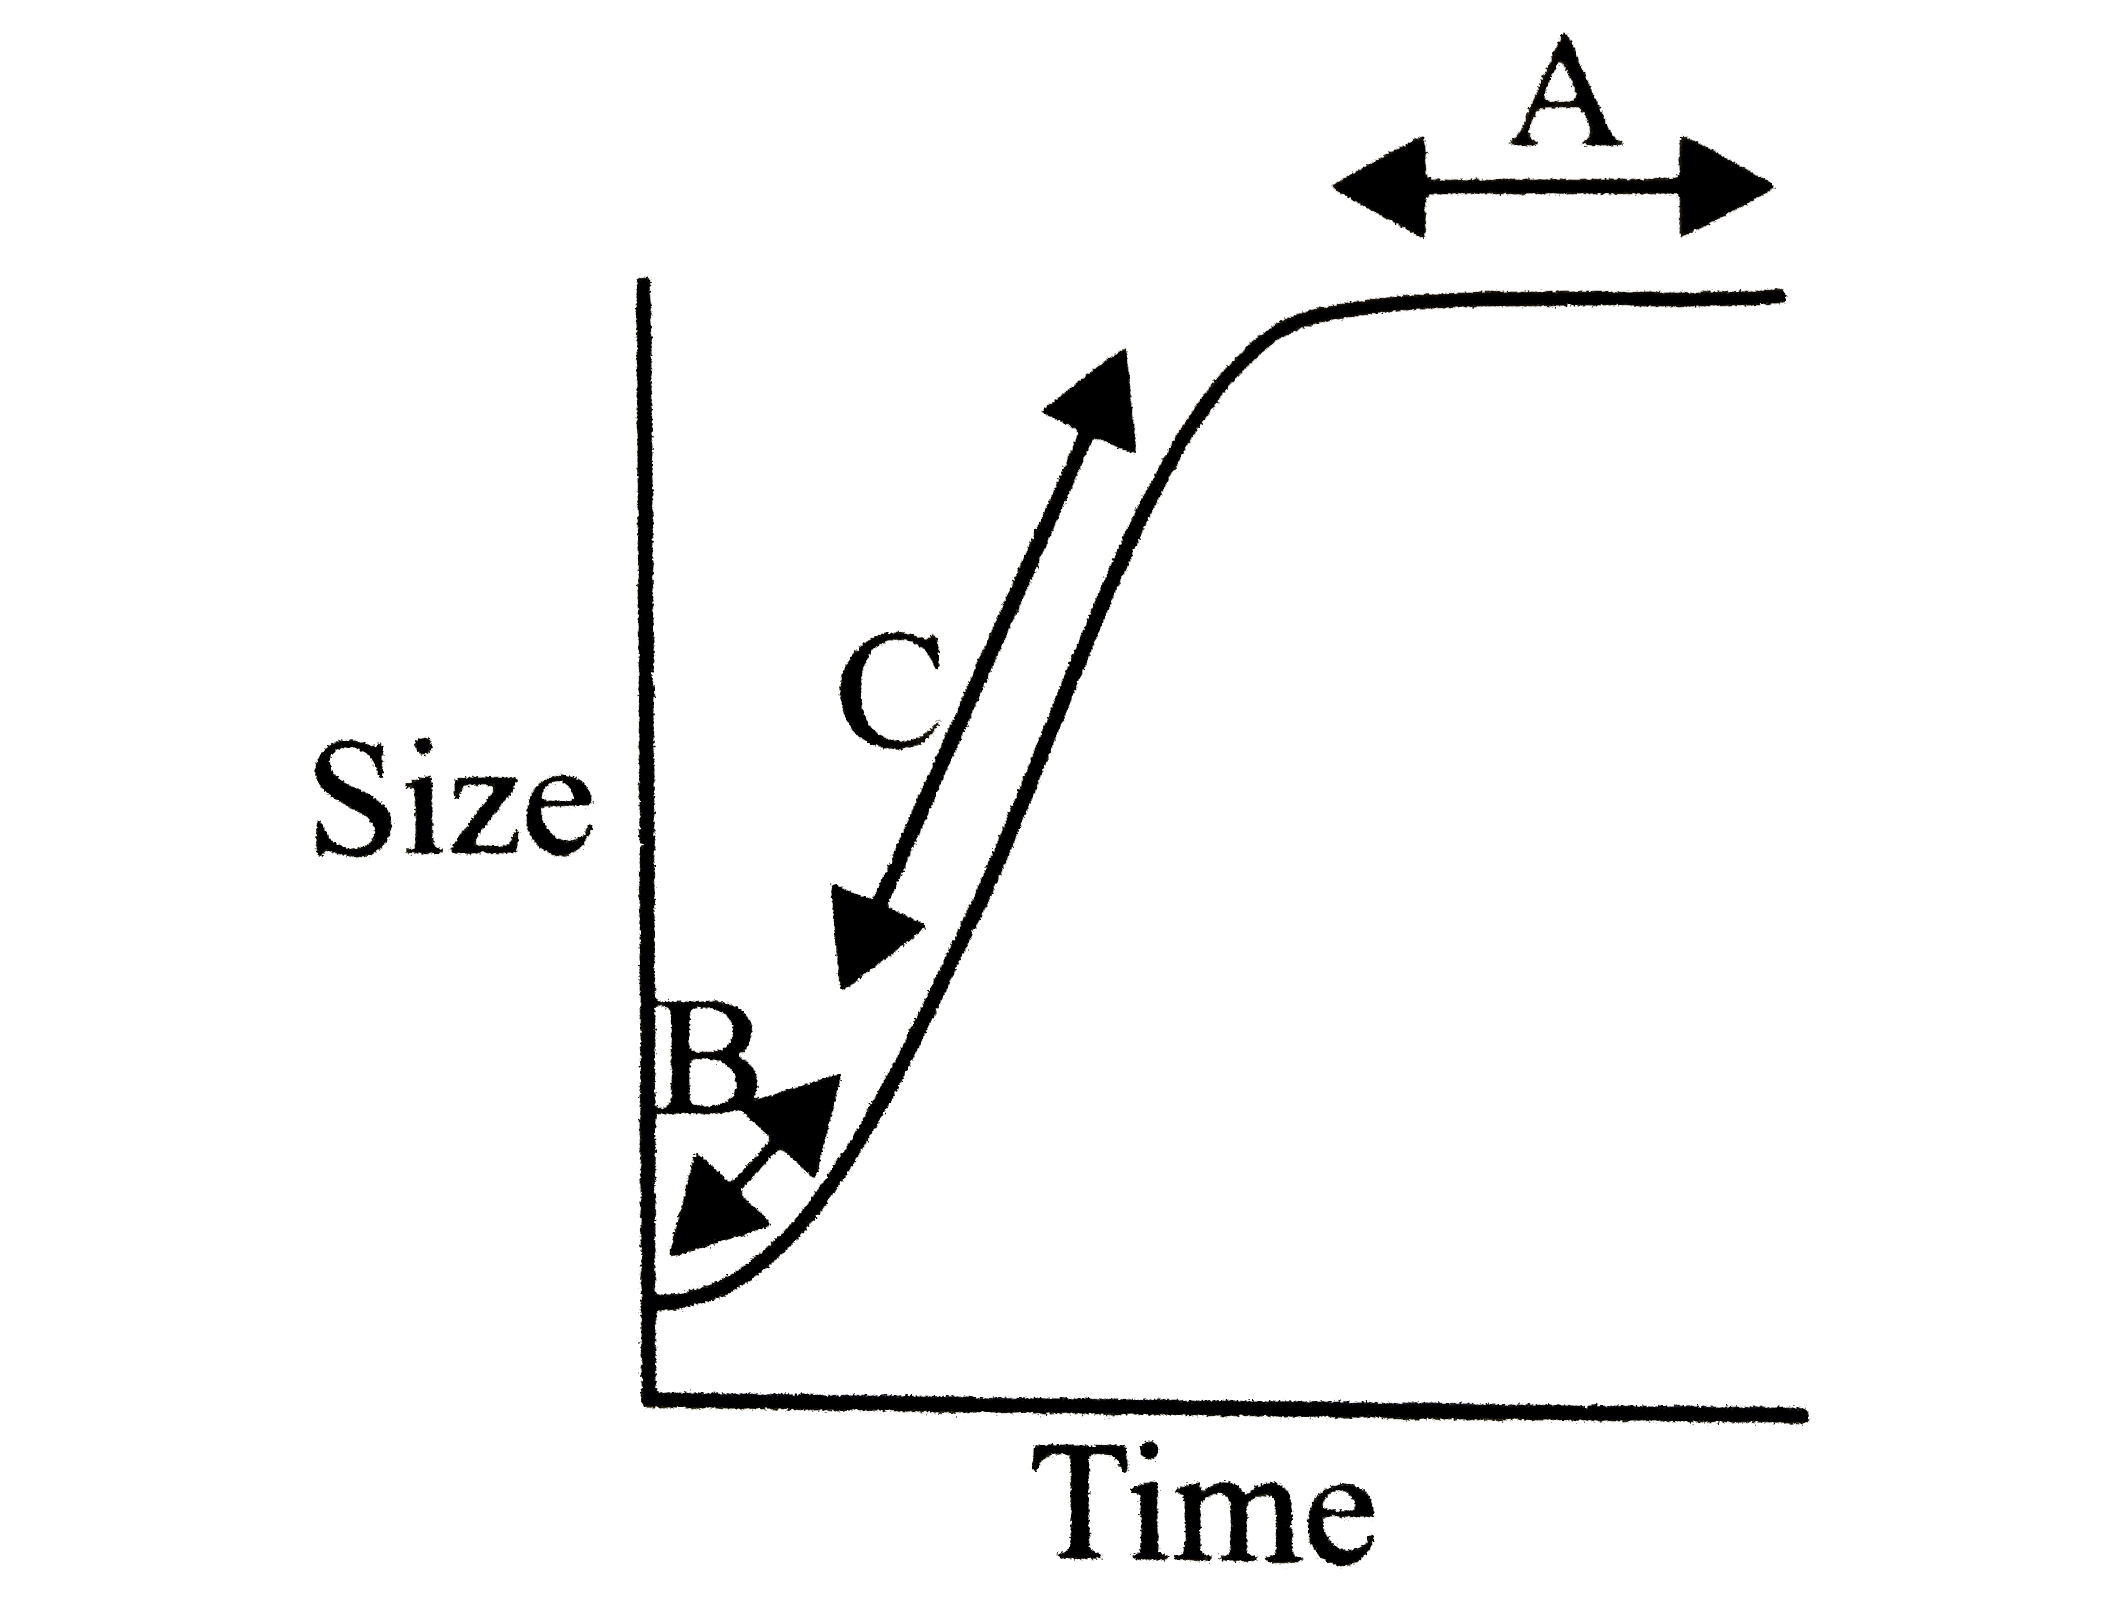
- Given graph is drawn on the parameters of growth versus time. Here A,B...
Text Solution
|
- Read the given statements and select the correct option. (i) One mar...
Text Solution
|
- The given figure shows growth of two leaves over the period of one day...
Text Solution
|
- A primary root grows from 5 cm to 19 cm in a week. Calculate the absol...
Text Solution
|
- The factors which influence growth are
Text Solution
|
- Cells of tracheary elements (trcheids and vessels) become dead at matu...
Text Solution
|
- Which of the following is an example of differentiation ?
Text Solution
|
- Living differentiated cells which have otherwise lost the capacity to ...
Text Solution
|
- The dedifferentiated cells mature to form some specific cells to perfo...
Text Solution
|
- are the examples of tissues, formed by dedifferentiation.
Text Solution
|
- Examples of tissues that are formed by redifferentiation are
Text Solution
|
- If a part of pith from the stem of a plant is used as an explant and c...
Text Solution
|
- includes all the changes that an organism undergoes during its life cy...
Text Solution
|
- Different kinds of structures develop in plants in different phase of ...
Text Solution
|
- In aquatic plant Ranunculus flabellair (buttercup), submerged leaves a...
Text Solution
|
- Intrinsic heterophylly is found in all except
Text Solution
|
- Development in plants is influenced by both intrinsic and extrinsic fa...
Text Solution
|
- Cytokinis are mostly
Text Solution
|