Home
Class 11
BIOLOGY
Which of the following graphs correctly ...

Which of the following graphs correctly depicts the rate of photosynthesis of sun plant (P) and shade plant (Q)?

A

B

C

D

Text Solution

AI Generated Solution

The correct Answer is:
To determine which graph correctly depicts the rate of photosynthesis for sun plants (P) and shade plants (Q), we need to understand how these two types of plants respond to varying light intensities. ### Step-by-Step Solution: 1. **Understanding Sun Plants and Shade Plants**: - Sun plants (P) are adapted to high light intensities and can achieve high rates of photosynthesis when exposed to strong sunlight. - Shade plants (Q), on the other hand, thrive in low light conditions and are more efficient at lower light intensities. They cannot achieve high photosynthetic rates under intense light. 2. **Graph Characteristics**: - The x-axis of the graph typically represents light intensity (photon flux density), while the y-axis represents the rate of photosynthesis (carbon dioxide uptake). - For sun plants, the graph should show a steep increase in the rate of photosynthesis with increasing light intensity, eventually reaching a plateau as it saturates. - For shade plants, the graph should show a more gradual increase in the rate of photosynthesis with light intensity, and it will not reach the same high rates as sun plants, even at high light intensities. 3. **Analyzing the Given Graphs**: - **Graph A**: Shows both plants rising rapidly and reaching high rates at high light intensity, which is incorrect for shade plants. - **Graph B**: Shows a plateau for sun plants at low light intensity, which is also incorrect because sun plants should rise steeply at high light intensity. - **Graph C**: Similar issues as Graph A, with both plants showing high rates at high light intensity. - **Graph D**: Shows sun plants rising steeply with increasing light intensity and shade plants rising more gradually, which is consistent with their respective adaptations. 4. **Conclusion**: - Based on the analysis, **Graph D** correctly depicts the rate of photosynthesis for sun plants (P) and shade plants (Q). Sun plants show a steep increase in photosynthesis with light intensity, while shade plants show a slower increase. ### Final Answer: The correct graph is **D**.

To determine which graph correctly depicts the rate of photosynthesis for sun plants (P) and shade plants (Q), we need to understand how these two types of plants respond to varying light intensities. ### Step-by-Step Solution: 1. **Understanding Sun Plants and Shade Plants**: - Sun plants (P) are adapted to high light intensities and can achieve high rates of photosynthesis when exposed to strong sunlight. - Shade plants (Q), on the other hand, thrive in low light conditions and are more efficient at lower light intensities. They cannot achieve high photosynthetic rates under intense light. ...
Promotional Banner

Topper's Solved these Questions

  • PHOTOSYNTHESIS IN HIGHER PLANTS

    NCERT FINGERTIPS ENGLISH|Exercise Photosynthesis In Higher Plants|136 Videos
  • NEURAL CONTROL AND COORDINATION

    NCERT FINGERTIPS ENGLISH|Exercise All Questions|144 Videos
  • PLANT GROWTH AND DEVELOPMENT

    NCERT FINGERTIPS ENGLISH|Exercise Plant Growth And Development|154 Videos

Similar Questions

Explore conceptually related problems

Which of the following correctly depicts the biochemical reaction of photosynthesis?

Which of the following correctly depicts the dental formula of a child?

Which of the following plants has the highest rate of photosynthesis?

Which of the following graphs best depicts the changes in one cycle of PCR ?

Which of the following is not a plant factor regulating the photosynthesis ?

Which of the following correctly depicts the aestivation of petals in the flower of cotton ?

Which of the following orders correctly depicts the decreasing order of stability of carbanion?

Which one of the following is limiting rate of photosynthesis in nature

Which of the following correctly characterizes the plant body of Funaria?

Choose the diagram which correctly depicts anaphase I

NCERT FINGERTIPS ENGLISH-PHOTOSYNTHESIS IN HIGHER PLANTS-Photosynthesis In Higher Plants
  1. When wheat and sugarcane leaves are fed with radioactive .^(14)CO(2). ...

    Text Solution

    |

  2. Which of the following equations holds true for acidification reaction...

    Text Solution

    |

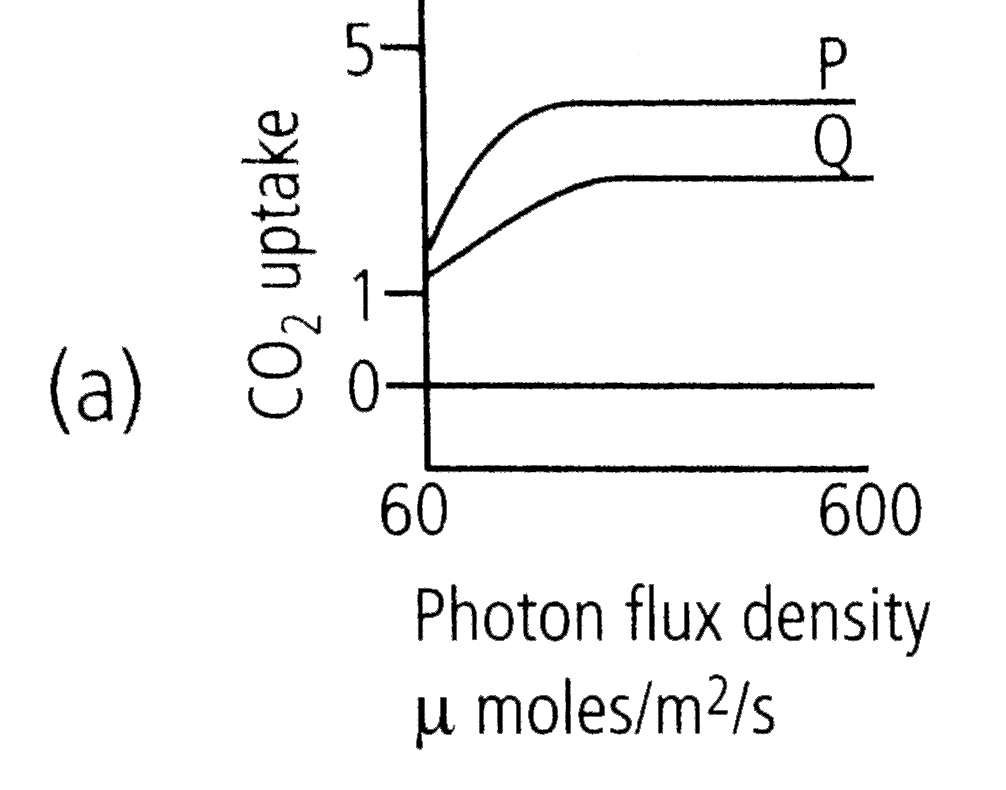
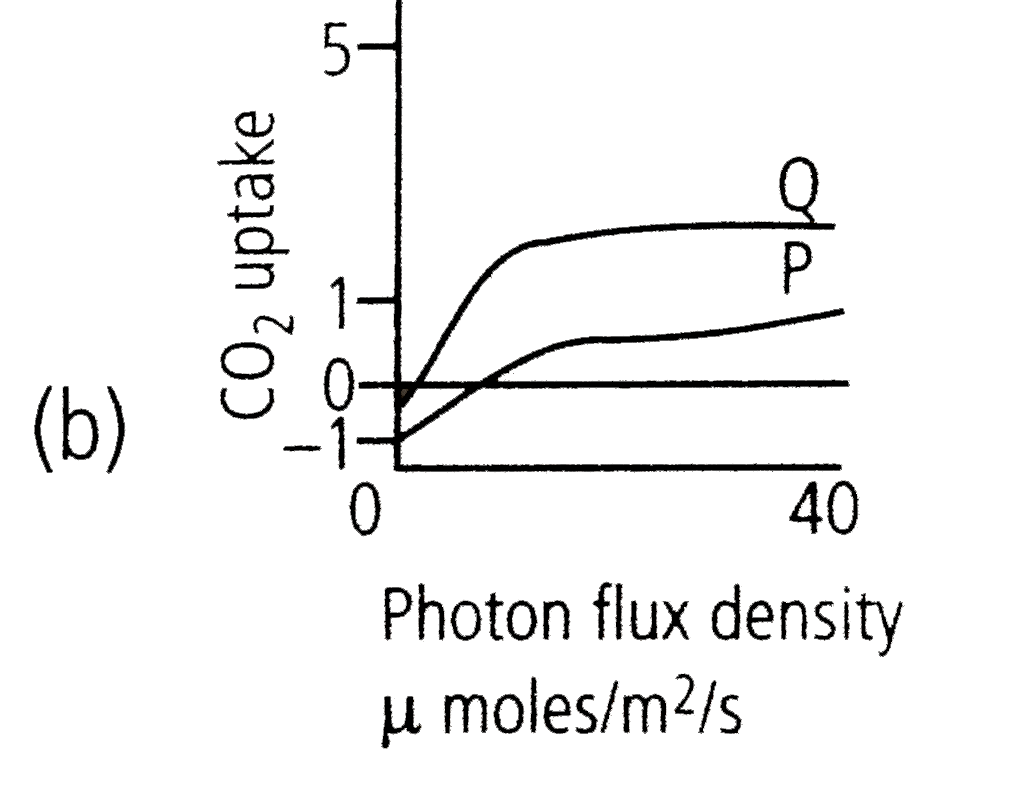
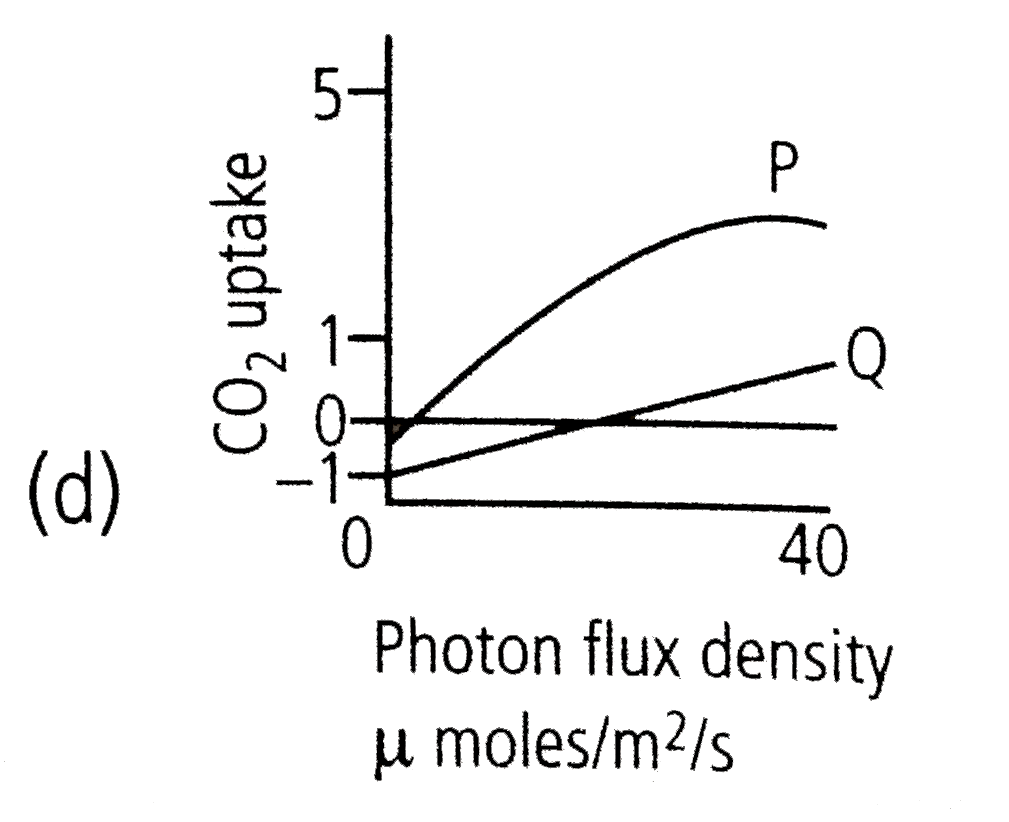
  3. Which of the following graphs correctly depicts the rate of photosynth...

    Text Solution

    |

  4. A typical light response curve of photosynthesis is shown. The limitin...

    Text Solution

    |

  5. Which metal ion is a constituent of chlorophyll?

    Text Solution

    |

  6. Which pigment acts directly to convert light energy to chemical energy...

    Text Solution

    |

  7. Which range of wavelenght (in nm) is called photosyntehtically active ...

    Text Solution

    |

  8. Which light range is least effective in phosynthesis?

    Text Solution

    |

  9. Chemosynthetic bacteria obtain energy from

    Text Solution

    |

  10. Energy required for ATP synthesis in PSII comes from

    Text Solution

    |

  11. During light reaction in photosynthesis the following are formed.

    Text Solution

    |

  12. Dark reaction in photosynthesis is called so because

    Text Solution

    |

  13. PEP is primary CO(2) acceptor in

    Text Solution

    |

  14. Splitting of water is associated with

    Text Solution

    |

  15. The correct sequency of flow of electons in the light reaction is

    Text Solution

    |

  16. The enzyme that is not found in a C(3) plant is

    Text Solution

    |

  17. The reaction that is responsible for the primary fixation of CO(2) is ...

    Text Solution

    |

  18. When CO(2) is added to PEP. The first stabel product synthesised is

    Text Solution

    |

  19. Assertion : Chloroplasta occur inside the leaves mostly in mesophyll c...

    Text Solution

    |

  20. Assertion: The color of the leaf is due to the presence of four pigmen...

    Text Solution

    |