Home
Class 11
BIOLOGY
The given graph shows an oxygen dissocia...

The given graph shows an oxygen dissociation curve for haemoglobin.

Wher is the body will haemoglobin be saturated at the percentage shown at point `1,2` and `3` in graph ?

A

`{:("Left ventricle","Pulmonary vein","Vena cava"),(1,2,3):}`

B

`{:("Left ventricle","Pulmonary vein","Vena cava"),(2,1,3):}`

C

`{:("Left ventricle","Pulmonary vein","Vena cava"),(2,3,1):}`

D

`{:("Left ventricle","Pulmonary vein","Vena cava"),(3,2,1):}`

Text Solution

Verified by Experts

The correct Answer is:
C

The relationship between the partial pressure of `O_(2) (PO_(2))` and percentage saturation of the Hb with `O_(2)` is graphically illustrated by a curve called oxygen dissociation curve. The haemoglobin is most saturated with oxygen in the pulmonary vein, as this vein is carrying oxygenated blood from the lungs towards the left auricle of the heart. From the left auricle the blood moves to the left ventrcile where saturation of Hb with `O_(2)` slightly reduces. Vena cava carries deoxygenated blood from all the organs of the body towards right auricle, thus, Hb is less saturated with `O_(2)`.
Promotional Banner

Topper's Solved these Questions

  • BREATHING AND EXCHANGE OF GASES

    NCERT FINGERTIPS ENGLISH|Exercise Higher Order Thinking|12 Videos
  • BREATHING AND EXCHANGE OF GASES

    NCERT FINGERTIPS ENGLISH|Exercise Exemplar Problems|13 Videos
  • BODY FLUIDS AND CIRCULATION

    NCERT FINGERTIPS ENGLISH|Exercise Body Fluids And Circulation|151 Videos
  • CELL - THE UNIT OF LIFE

    NCERT FINGERTIPS ENGLISH|Exercise Cell - The Unit Of Life|159 Videos

Similar Questions

Explore conceptually related problems

Oxygen dissociation curve of haemoglobin is

Given below graphs an oxygen dissociation curve :- Where in the body will haemoglobin be saturation at the percentage shown at points X,Y and Z.

What is the shape of O_(2) dissociation curve for haemoglobin ?

In which conditon oxygen dissociation curve of haemoglobin shift to right of normal curve ?

The graph shows the oxygen dissociation curves of haemoglobin from two species of mammals, s and T . Which statements could explain the difference in the oxygen dissociation curves of species S and species T ? I. Species T has higher haemoglobin concentration in its red blood cells than species S. II. The haemoglobin in species T has a lower affinity for oxygen than the haemoglobin in species S. III. Species T may be living at a higher altitudes than species S.

When parital pressure of CO_(2)(p CO_(2)) rises the oxygen dissociation curve of haemoglobin will

The percentage of haemoglobin saturated with oxygen will increase if the

The oxygen - haemoglobin dissociation curve will show a right shift in case of

The oxygen - haemoglobin dissociation curve will show a right shift in case of

The oxygen - haemoglobin dissociation curve will show a right shift in case of

NCERT FINGERTIPS ENGLISH-BREATHING AND EXCHANGE OF GASES-Breathing And Exchange Of Gases
  1. The oxygen dissociation curve is

    Text Solution

    |

  2. Which of the following is incorrect about the given graph ?

    Text Solution

    |

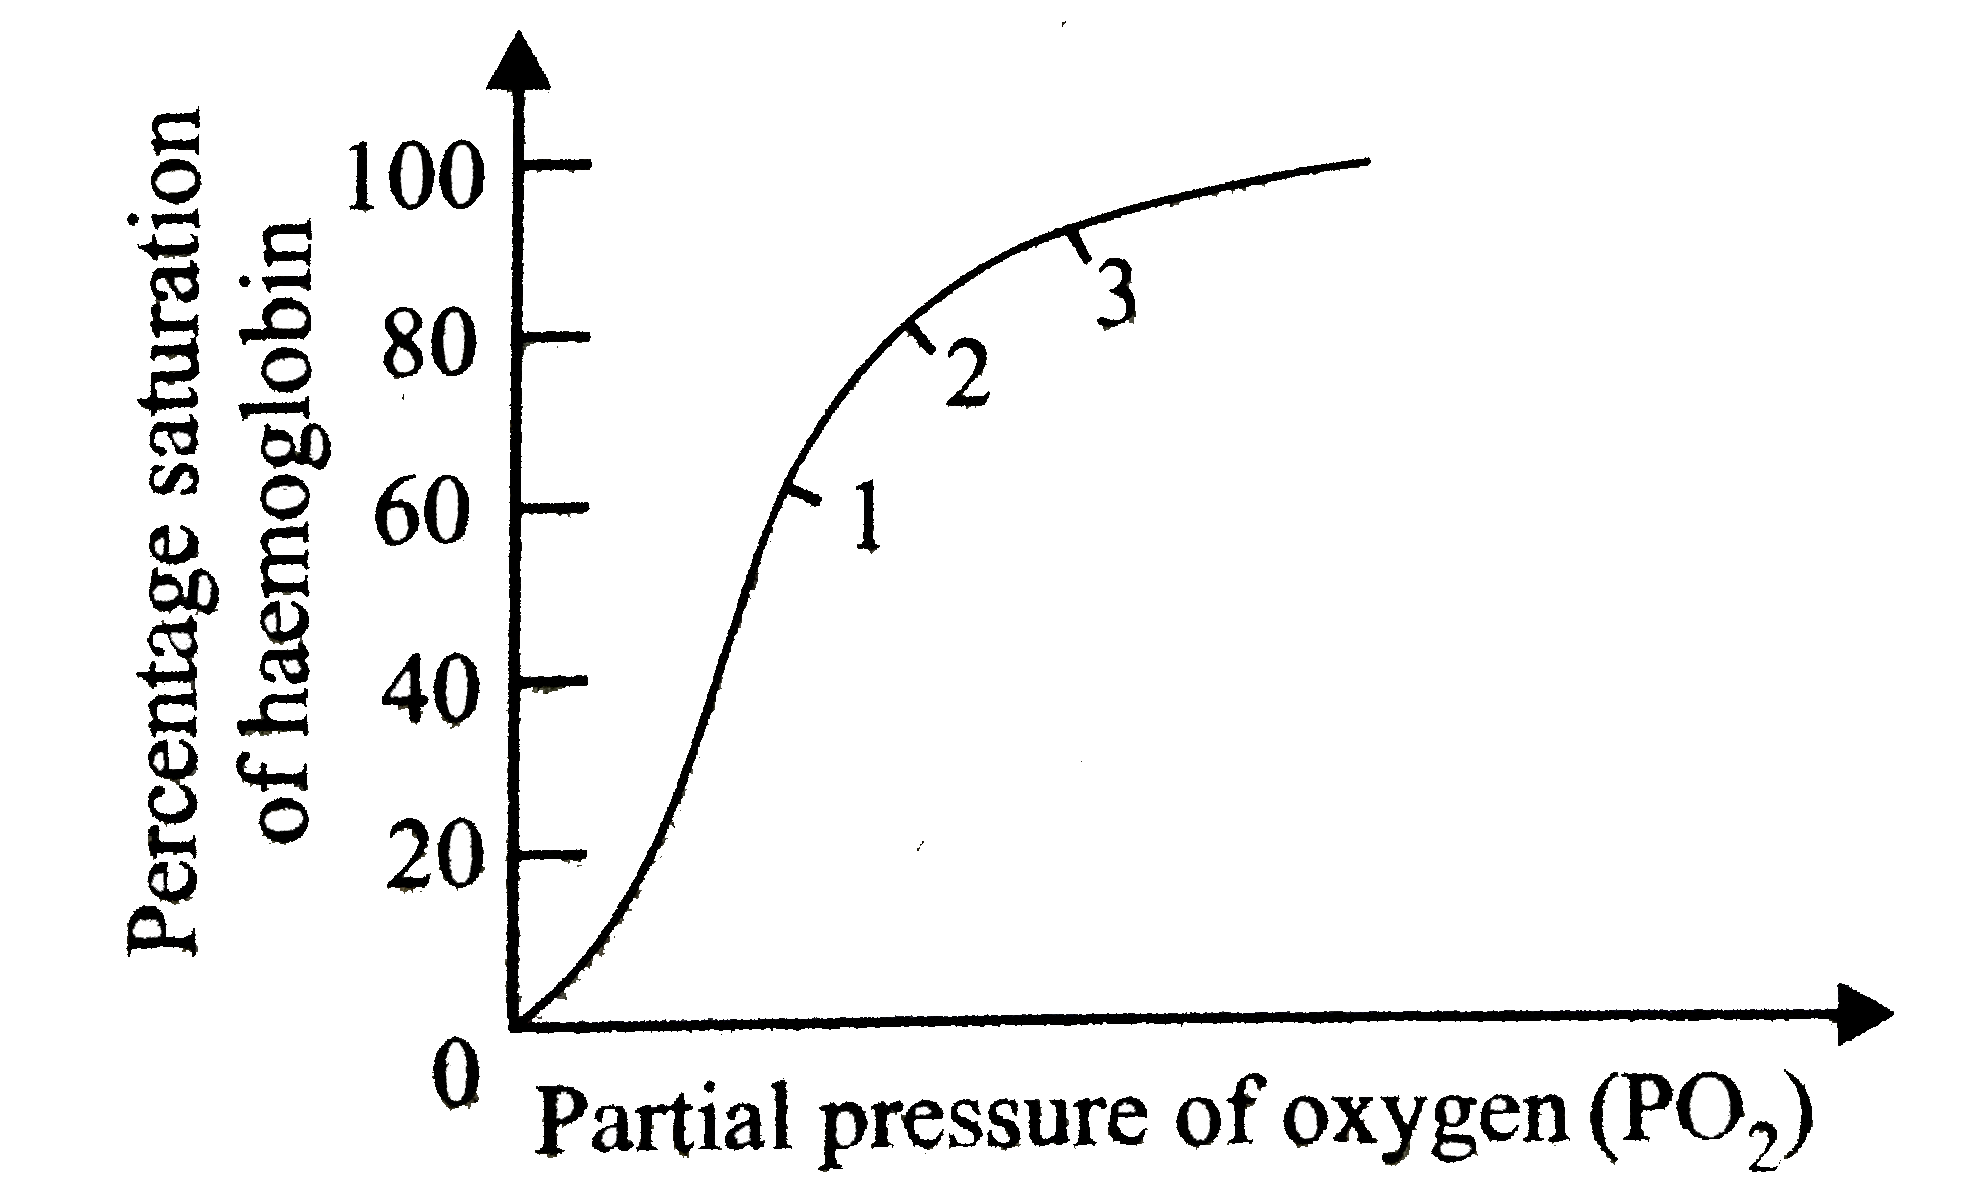
  3. The given graph shows an oxygen dissociation curve for haemoglobin. ...

    Text Solution

    |

  4. When temperature decrease, oxy-Hb curve becomes

    Text Solution

    |

  5. Which of the following factors is not favourable for the formation of ...

    Text Solution

    |

  6. Consider for following four statements and select the correct option s...

    Text Solution

    |

  7. After taking a long deep breath we do not respire for some seconds due...

    Text Solution

    |

  8. A large proportion of oxygen remain unused in the human blood even aft...

    Text Solution

    |

  9. In the tissues, high concentrations of carbon dioxide

    Text Solution

    |

  10. Fetal haemoglobin has X affinity for oxygen than that of mother's haem...

    Text Solution

    |

  11. Statement 1 : About 70% of CO(2) that enters RBCs changes into HCO(3)^...

    Text Solution

    |

  12. Match column I with column II and select the correct option from the c...

    Text Solution

    |

  13. The enzyme that increases the reaction rate between CO(2) and H(2)O i...

    Text Solution

    |

  14. Which of the following equations is correct ?

    Text Solution

    |

  15. People living at sea level have around 5 million RBC per cubic millime...

    Text Solution

    |

  16. During CO(2) transport, HCO(3)^(-) diffuses from erythrocytes to plas...

    Text Solution

    |

  17. Identify the correct statement with reference to transport of respirat...

    Text Solution

    |

  18. Which of the following is ture for CO(2) concentration ?

    Text Solution

    |

  19. In humans which of the following is not a step in respiration?

    Text Solution

    |

  20. Although much CO(2) is carried in blood, yet blood does not become aci...

    Text Solution

    |