A
B
C
D
Text Solution
Verified by Experts
The correct Answer is:


Topper's Solved these Questions
TRANSPORT IN PLANTS
NCERT FINGERTIPS ENGLISH|Exercise Exemplar Problems|12 VideosTRANSPORT IN PLANTS
NCERT FINGERTIPS ENGLISH|Exercise Transport In Plants|119 VideosTRANSPORT IN PLANTS
NCERT FINGERTIPS ENGLISH|Exercise Phloem Transport:Flow From Source To Sink|11 VideosTHE LIVING WORLD
NCERT FINGERTIPS ENGLISH|Exercise The Living World|130 Videos
Similar Questions
Explore conceptually related problems
NCERT FINGERTIPS ENGLISH-TRANSPORT IN PLANTS-Higher Order Thinking Skills
- Given figure shows U-shaped tube with two hands A and B separated by a...
Text Solution
|
- Given figure demonstrates the translocation of organic solutes accordi...
Text Solution
|
- Stomatal opening and closing involves the role of various ions. In the...
Text Solution
|
- Stomatal movements are influenced by a number of environmental factors...
Text Solution
|
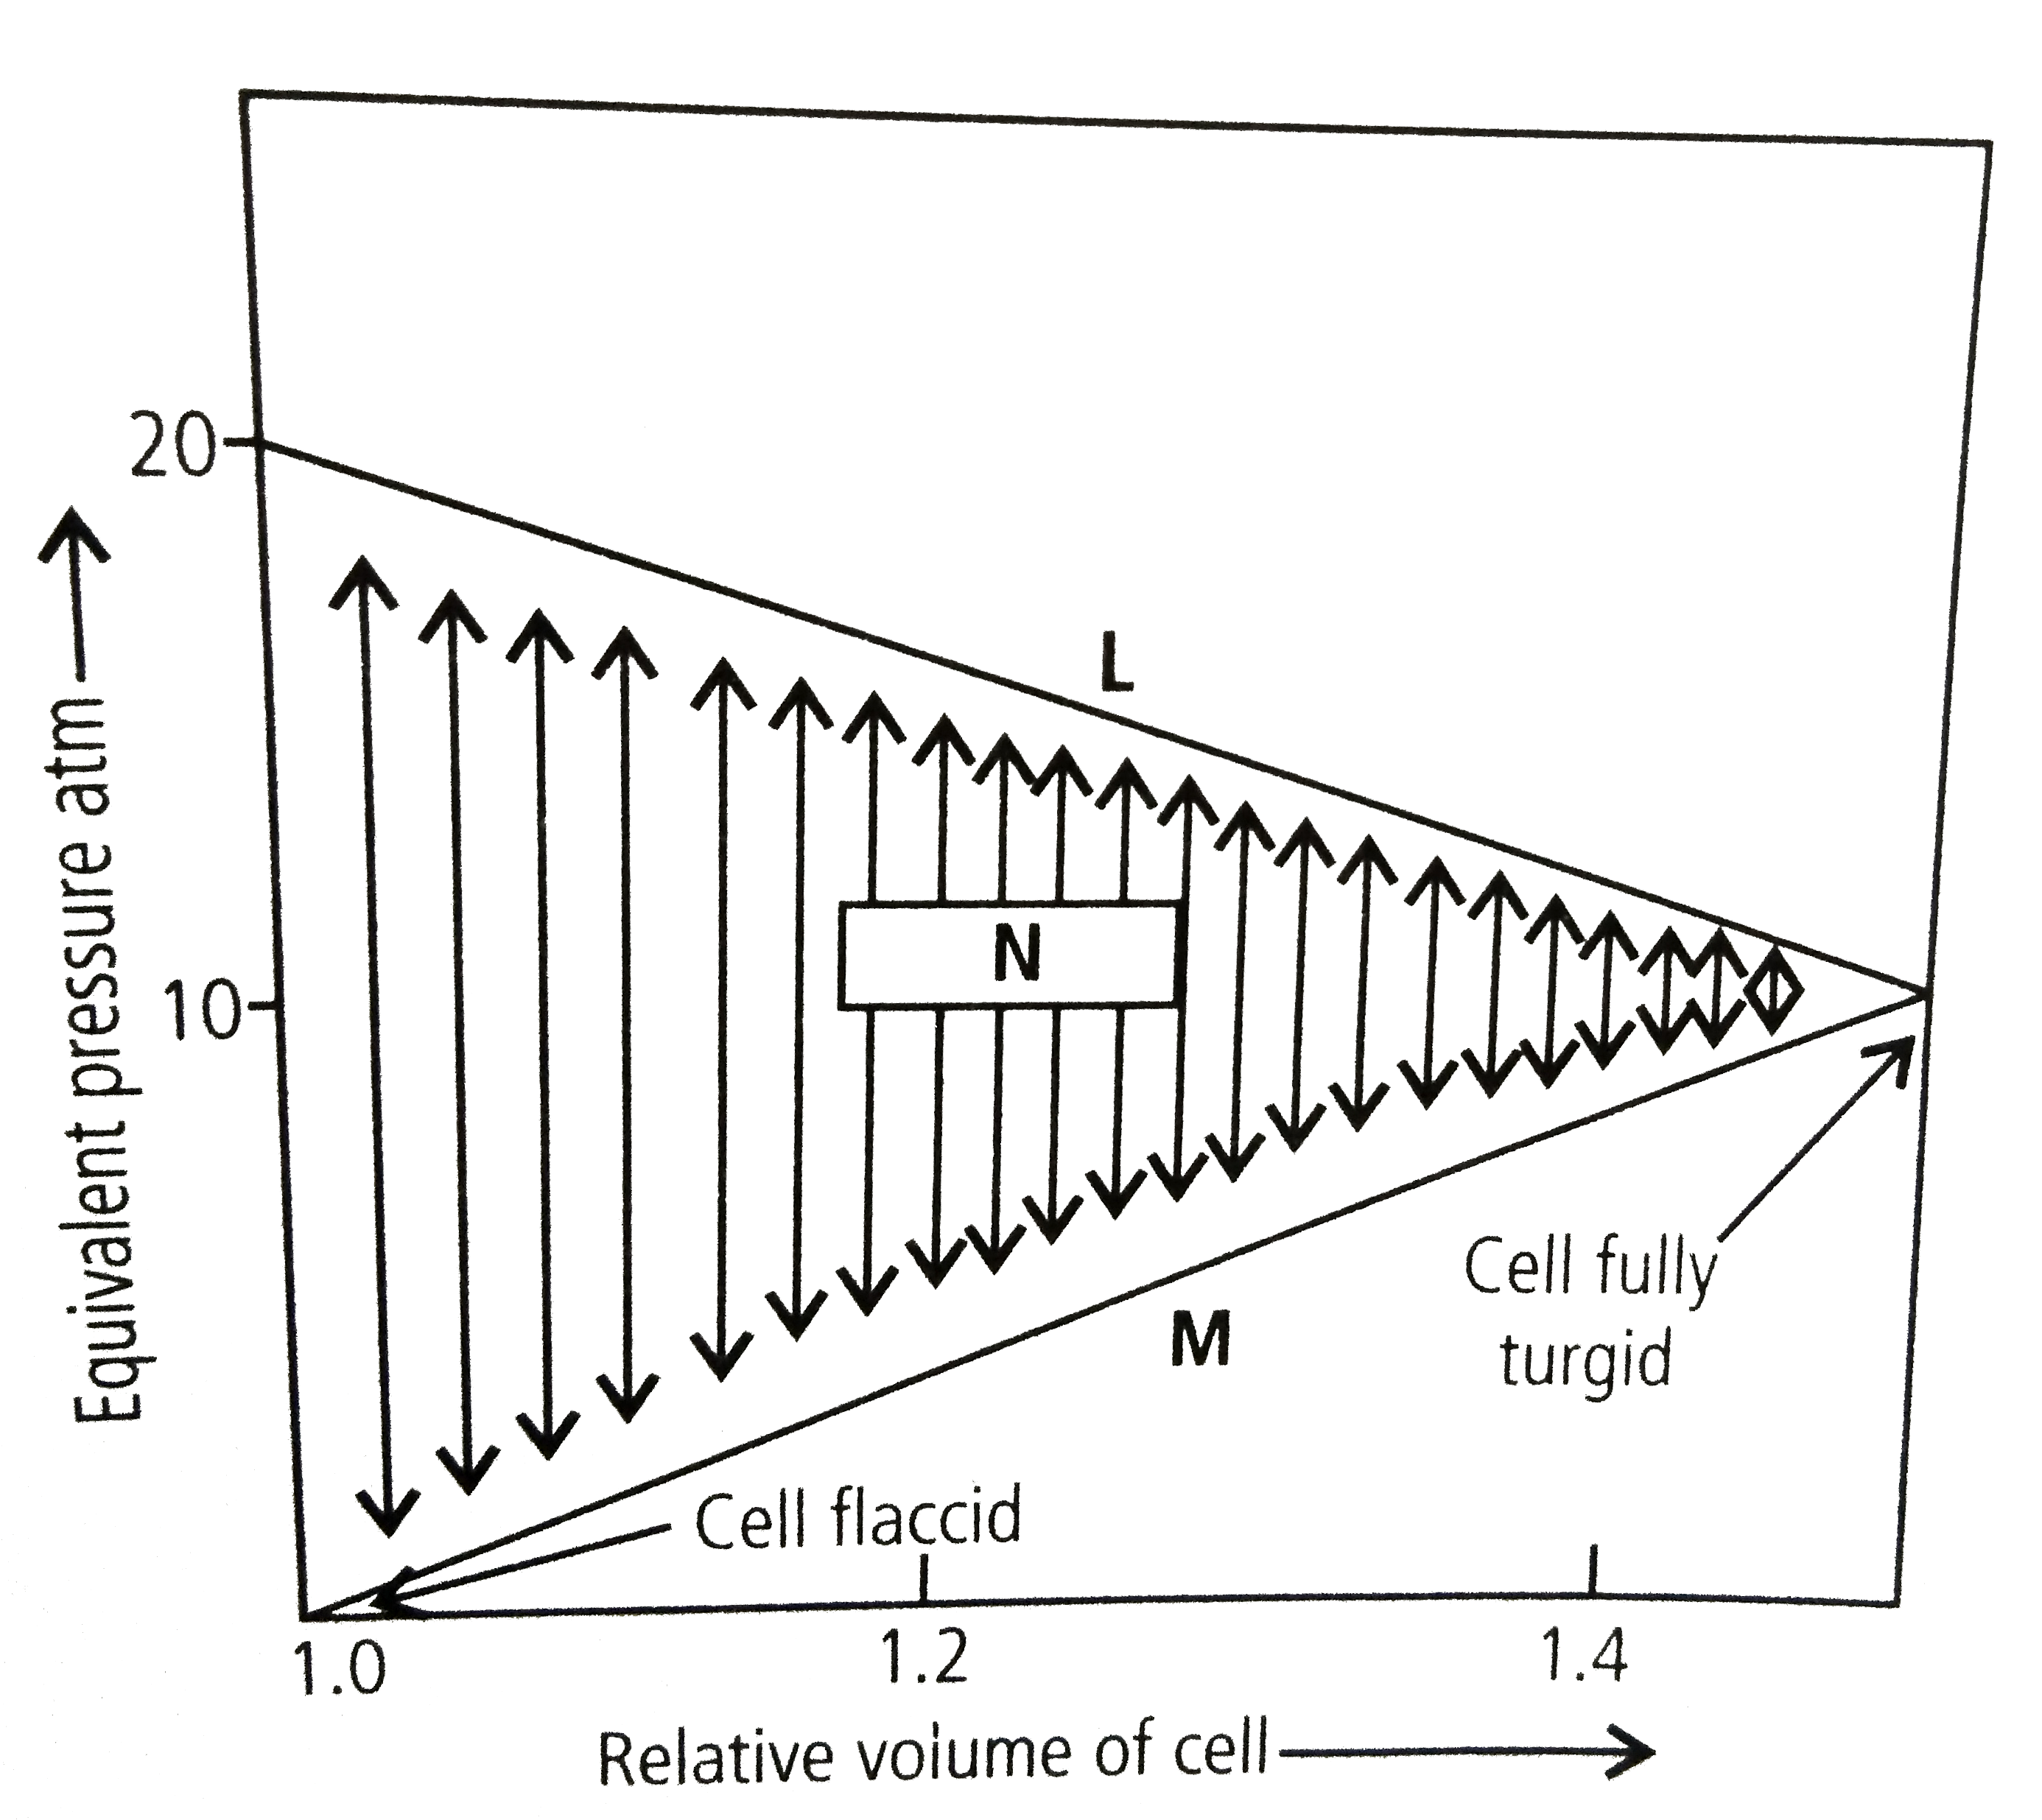
- Given diagram illustrates the changes that occur when a plant cell tak...
Text Solution
|
- the given diagram illustrates stomata closing the major mistake in the...
Text Solution
|
- On a warm summer day the transpiration pull is the main force that dri...
Text Solution
|