A
B
C
D
Text Solution
Verified by Experts
The correct Answer is:


Similar Questions
Explore conceptually related problems
Recommended Questions
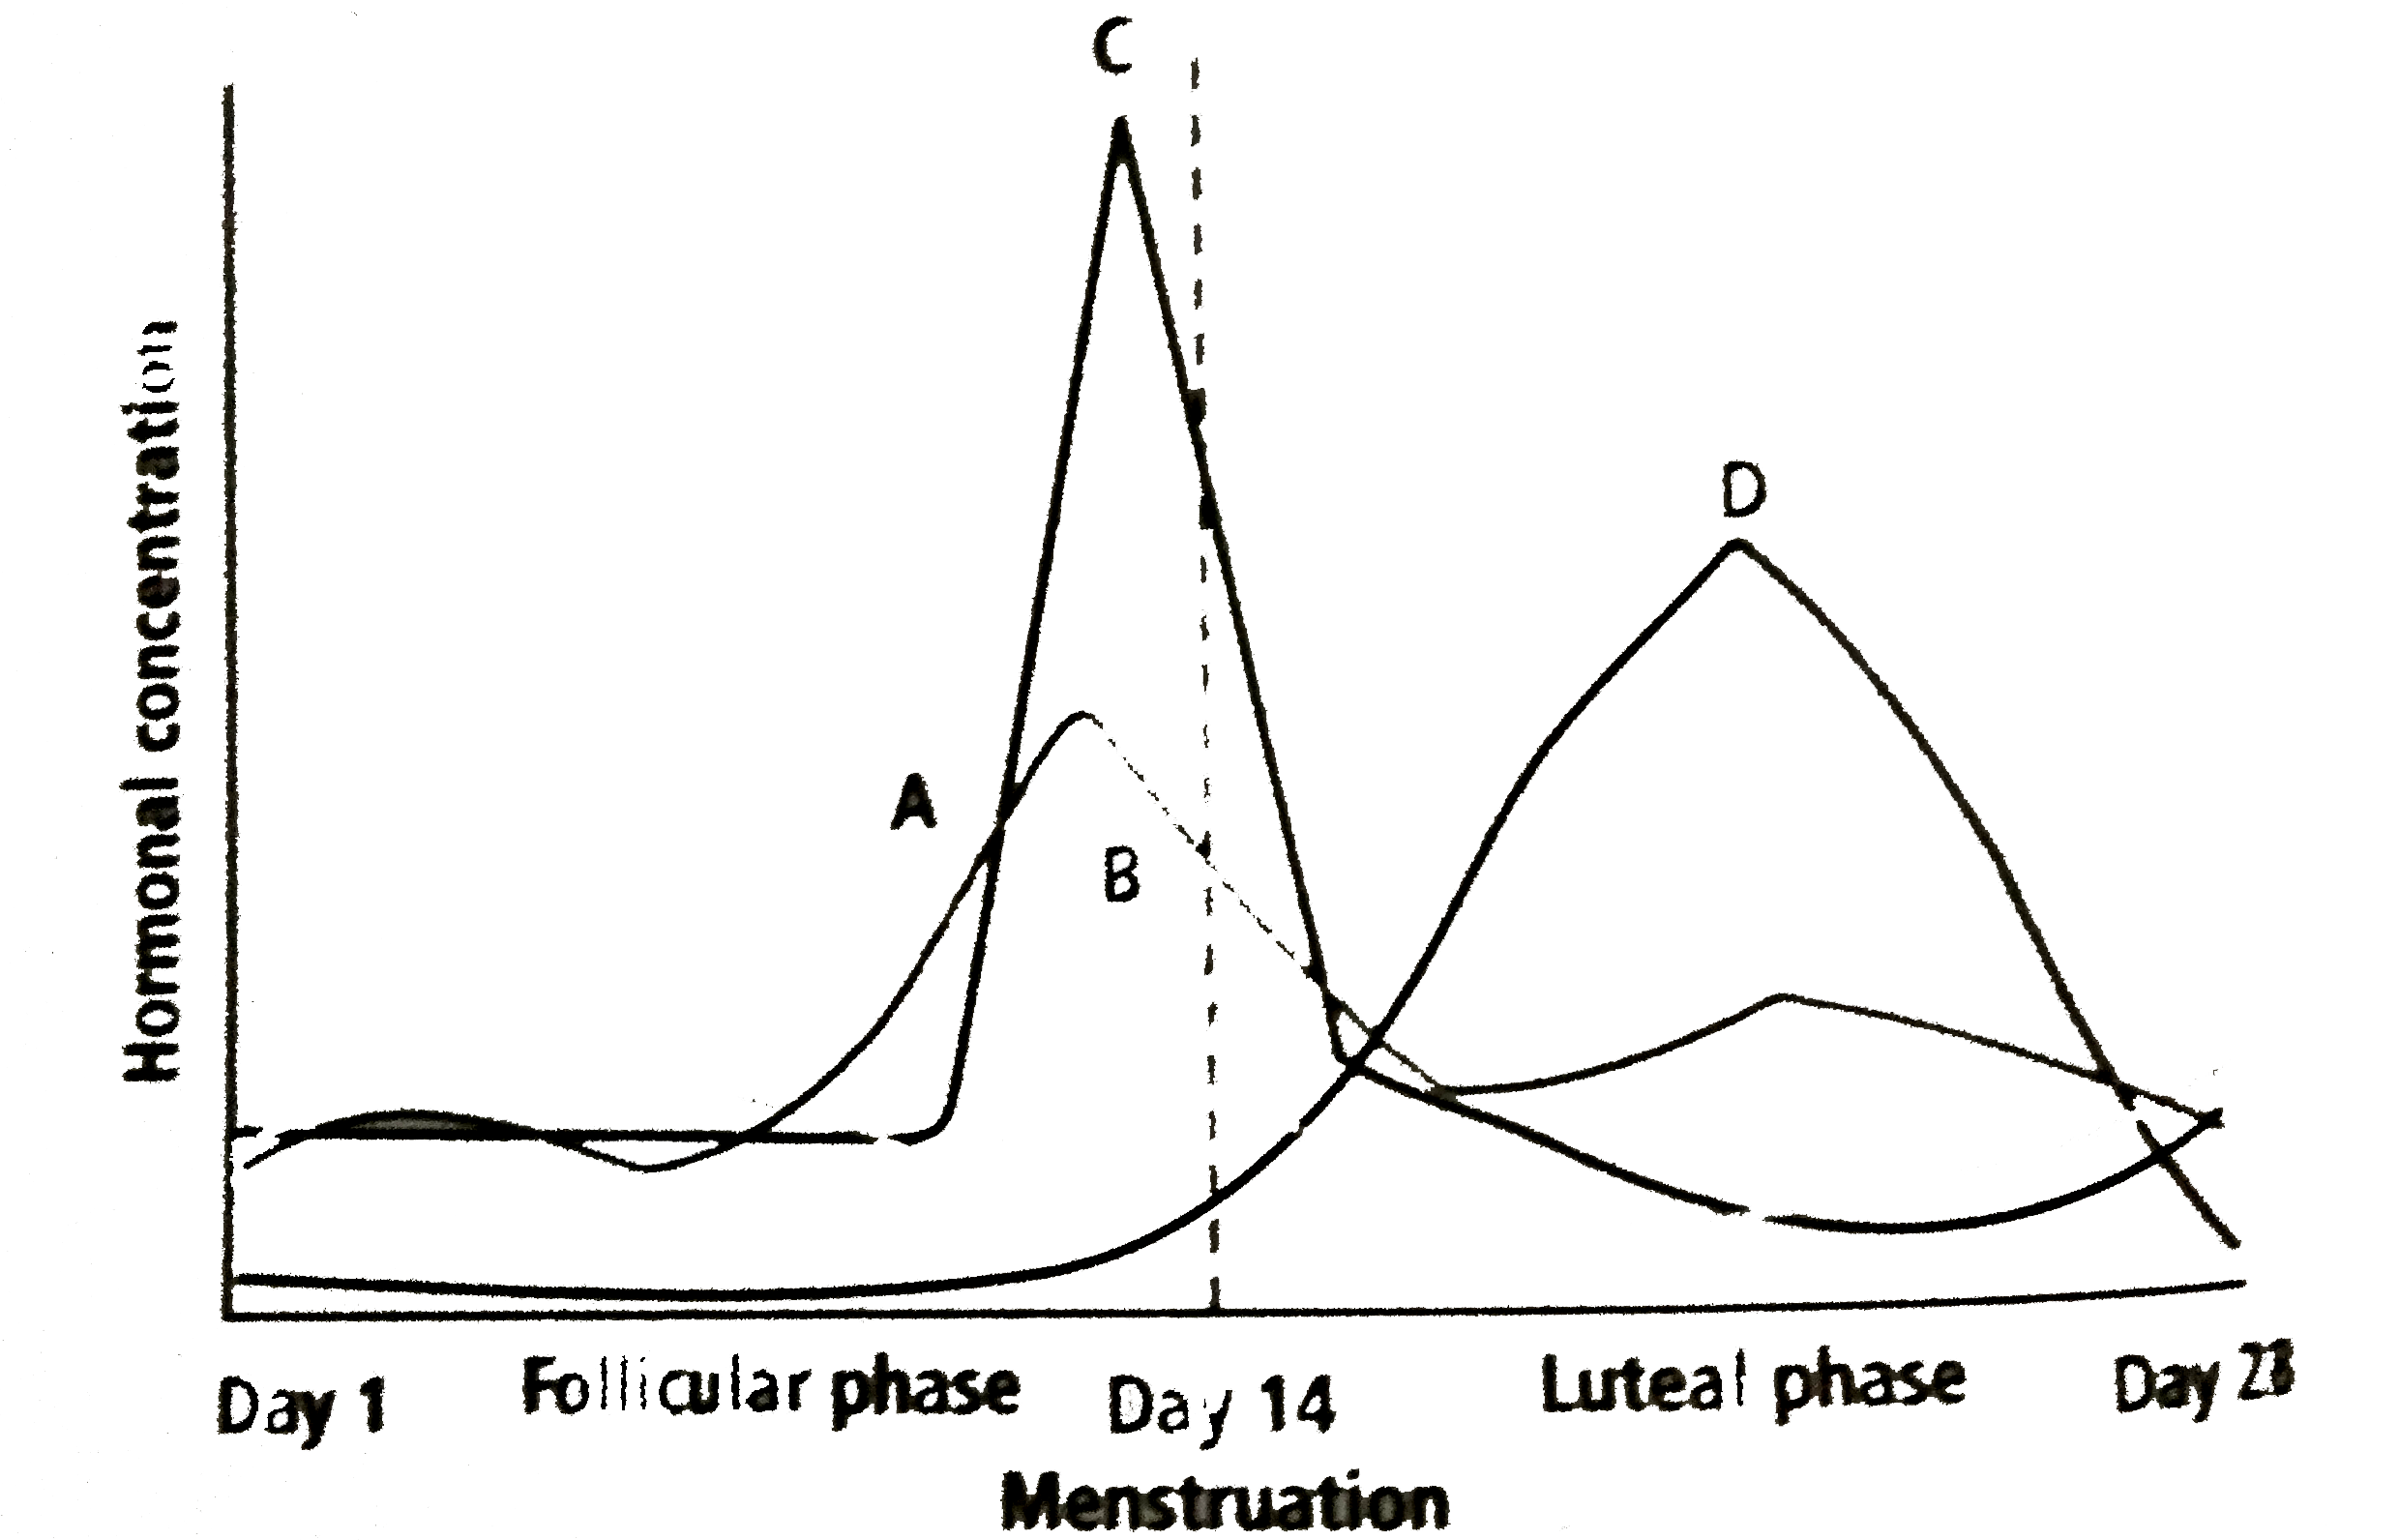
- Refer to the given graph representing interplay of different hormones ...
Text Solution
|
- The following graph shows the levels of ovarian hormones during a mens...
Text Solution
|
- During bleeding phase of menstrual cycle unfertilised secondary oocyte...
Text Solution
|
- Refer to the given graph representing interplay of different hormones ...
Text Solution
|
- Refer to the given graph representing interplay of different hormones ...
Text Solution
|
- Refer to the given graph representing interplay of different hormones ...
Text Solution
|
- Refer to the given graph representing interplay of different hormones ...
Text Solution
|
- Hormone excreted in females in urine after menopause is
Text Solution
|
- Hormone that regulates the menstrual cycle in women
Text Solution
|