
A

B
C

D

Text Solution
Verified by Experts
The correct Answer is:


Topper's Solved these Questions
Similar Questions
Explore conceptually related problems
NCERT FINGERTIPS ENGLISH-EVOLUTION-All Questions
- In order to build a longitudinal data set, data of adult finches Geosp...
Text Solution
|
- The following summaries describe some published research results. Re...
Text Solution
|
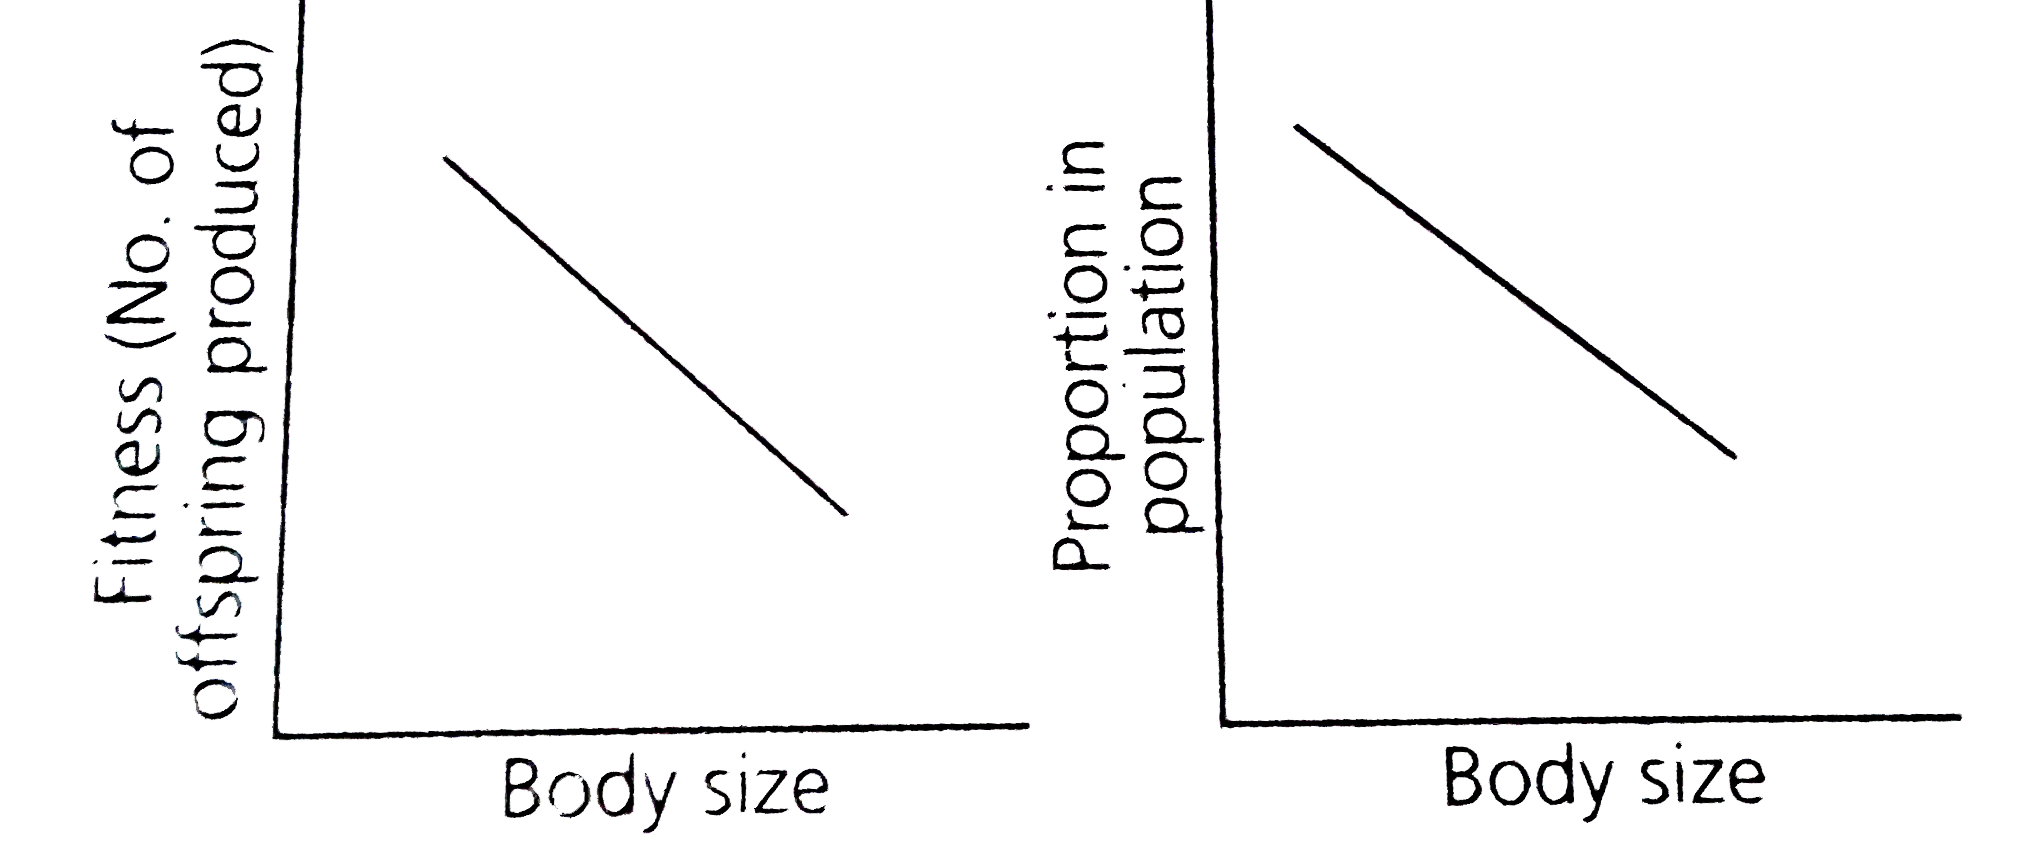
- Study the charactristics of a population represented in the graphs bel...
Text Solution
|
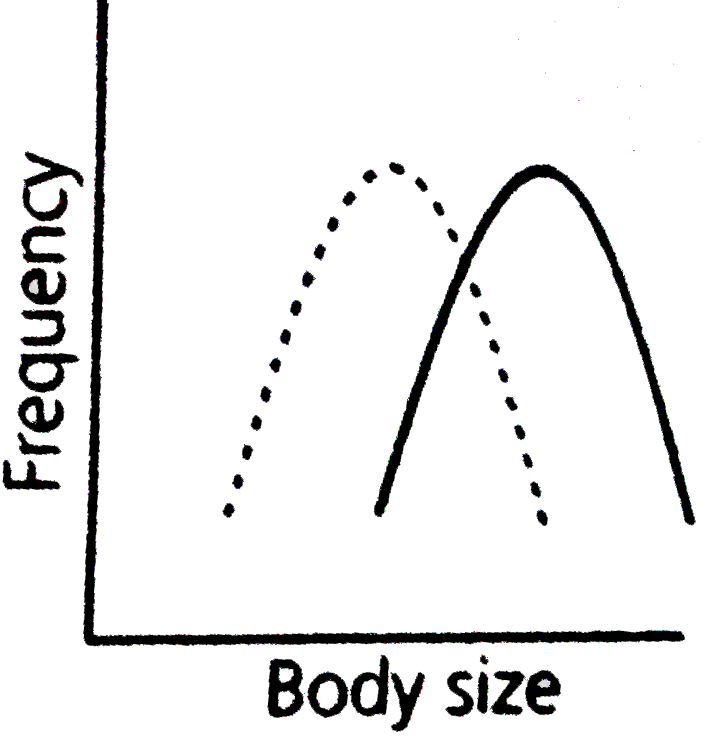
- Study the charactristics of a population represented in the graphs bel...
Text Solution
|
- Following table shows data on amino acid substitution in the alpha cha...
Text Solution
|
- In a long term experiment of a population of Drosophila melnogaster, t...
Text Solution
|
- In a large, randomly mating population, only one person in 10,000 is a...
Text Solution
|
- Which of the following is used an atomospheric pollution indicator?
Text Solution
|
- The theory of spontaneous generation stated that
Text Solution
|
- Animal husbandry and plant breeding programmers are the examples of
Text Solution
|
- Palaentological evidences for evolution refer to the
Text Solution
|
- The bones of forelimbs of whale, bat, cheetah and man are similar in s...
Text Solution
|
- Analogous organs arise due to
Text Solution
|
- (pq)^(2)+2pq+q^(2)=1 represents an equation used in
Text Solution
|
- Appearance of antibiotic-resistant bacteria is an example of
Text Solution
|
- Evolution of life shows that life hard a trent of moving from
Text Solution
|
- Viviparity is considered to be more evolved because
Text Solution
|
- Fossils are generally found in
Text Solution
|
- For the MN-blood group system. The frequencies of M and N alleles are ...
Text Solution
|
- Which type of selection is industrial melansim observed in month, Bist...
Text Solution
|