A
B
C
D
Text Solution
Verified by Experts
The correct Answer is:


Topper's Solved these Questions
ORGANISMS AND POPULATION
NCERT FINGERTIPS ENGLISH|Exercise HOTS|5 VideosORGANISMS AND POPULATION
NCERT FINGERTIPS ENGLISH|Exercise NCERT|20 VideosMOLECULAR BASIS OF INHERITANCE
NCERT FINGERTIPS ENGLISH|Exercise Molecular Basis Of Inheritance|151 VideosPRACTICE PAPERS
NCERT FINGERTIPS ENGLISH|Exercise Practice paper|150 Videos
Similar Questions
Explore conceptually related problems
NCERT FINGERTIPS ENGLISH-ORGANISMS AND POPULATION-Organisms And Population
- Which of the following equations correctly represents Verhulst-Pearl l...
Text Solution
|
- The population growth is generally described by the following equation...
Text Solution
|
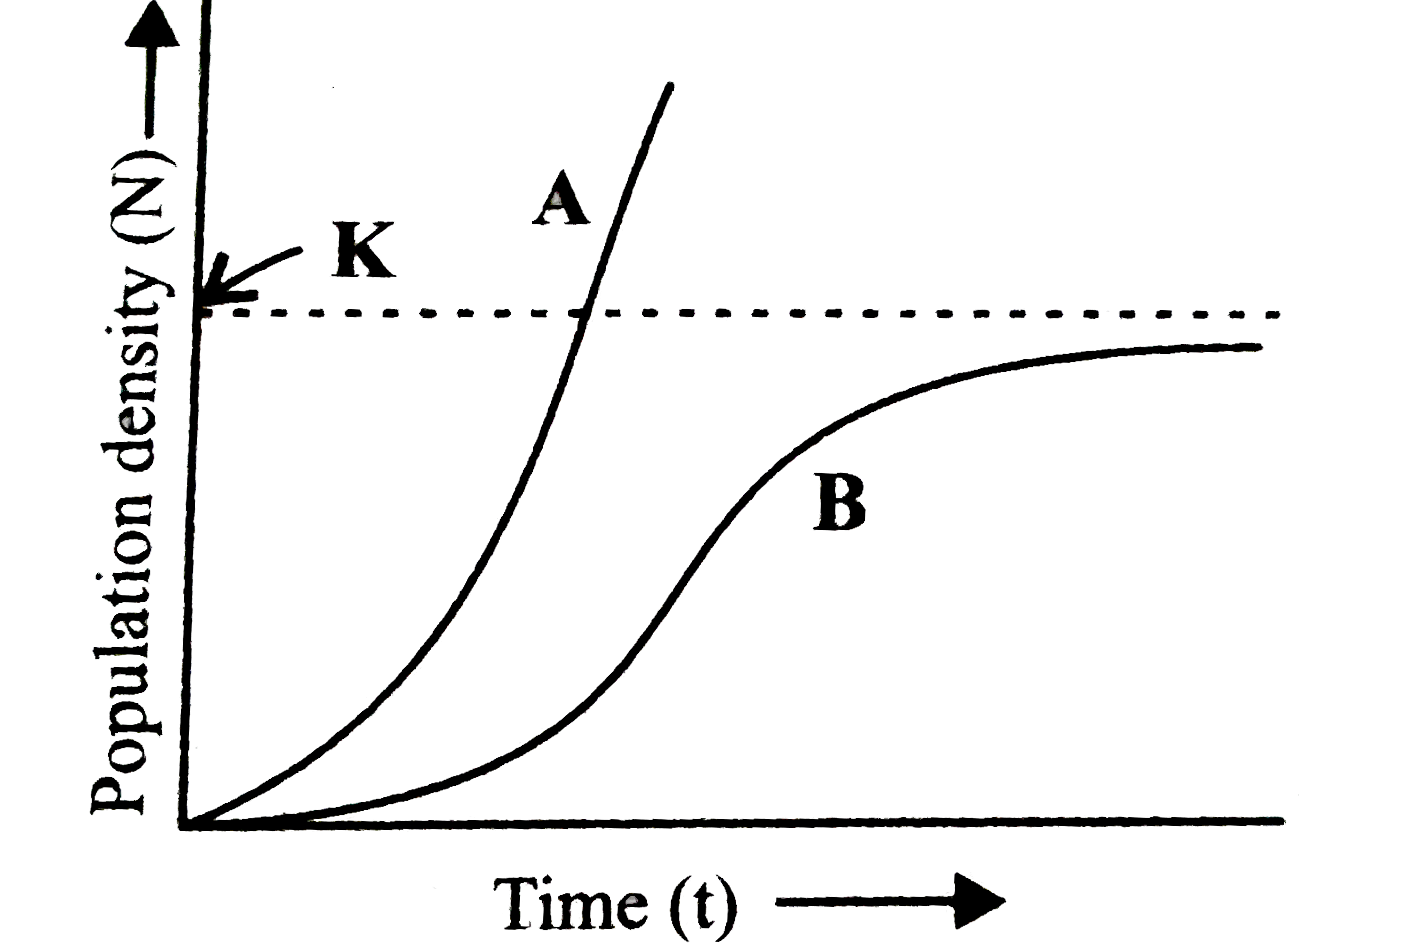
- Study the population growth curves (A and B) in the given graph and se...
Text Solution
|
- Which of the following statements is correct ?
Text Solution
|
- Species interaction with negative influence on both is referred to as
Text Solution
|
- Refer to the given table. If '+' sign has been assigned for beneficial...
Text Solution
|
- Refer to the given table that summarises the interactions between two ...
Text Solution
|
- Which type of interaction is being shown in the given figure ?
Text Solution
|
- Which of the following is an advantage of predation ?
Text Solution
|
- Read the following statements and select the correct option. Stateme...
Text Solution
|
- The pricky pear cactus became unusually abundant after its introductio...
Text Solution
|
- Why you never see cattle or goats browsing on weed Calotropis ?
Text Solution
|
- Which of the following is not an example of prey- predator relationshi...
Text Solution
|
- On the rocky sea coasts of Scotland, the larger and competitively supe...
Text Solution
|
- Competitive exclusion principle stating that inferior species is elimi...
Text Solution
|
- Two different species cannot live for long duration in the same niche ...
Text Solution
|
- Two species competing for the same resource can avoid competition by c...
Text Solution
|
- When two similar species live in the same area, they may evolve to bec...
Text Solution
|
- Which of the following statements is/are correct ?
Text Solution
|
- In laboratory experiments, two species of the protist Paramecium (spec...
Text Solution
|