Home
Class 12
BIOLOGY
The graph given below represents changes...

The graph given below represents changes in different ecological parameters due to effluent mixing in a stream. The three lines A, B anc C represent

A

A: oxygen concentration
B: biological `O_(2)` demand
C: pollution resistant species

B

A: pollutan
B: aerobic process
C: anaerobic process

C

A: oxygen concentration
B: `CO_(2)` concentration
C: termperature

D

A: phosphate concentration
B: nitrate concentration
C: rate of photosynthesis.

Text Solution

Verified by Experts

The correct Answer is:
A

Effluent discharge mixing into a river will result in rise of BOD because decomposer organisms consume a lot of oxygen. If sewage quantity is large, the whole of dissolved oxygen may be consumed leaving nothe for respiration of fish and other clean water organisms. They, therfore, get killed. However, as sewage is decomposed, there is a gradual rise in dissolved oxygen downstream. Fish and other clean water organisms reappear indicating the recovery of river from sewage pollution. Meanwhile, number of pollution resistant species increases in the stream.
Promotional Banner

Topper's Solved these Questions

  • ENVIRONMENTAL ISSUES

    NCERT FINGERTIPS ENGLISH|Exercise Environmental Issues|142 Videos
  • ECOSYSTEM

    NCERT FINGERTIPS ENGLISH|Exercise Ecosystem|140 Videos
  • EVOLUTION

    NCERT FINGERTIPS ENGLISH|Exercise All Questions|160 Videos

Similar Questions

Explore conceptually related problems

The graph given below represents the linear equation x=3.

The graph given below represents the linear equation x+y=0.

(a) The graph given below represents the organisms response to temperature as an environmental condition. (i) Which one of the two lines represents conformers and why ? (ii) What does the other line in the graph represent and why ? (b) Mention the different adaptations the parasites have evolved with, to be able to successfully complete their life cycles in their hosts.

The diagram given below represents a section of small intestinal mucosa. Identify A,B and C

Given below are the seats won by different political parties in the polling outcome of a state assembly elections: (i) Draw a bar graph to represent the polling result

The graph given below represents the effect of sewage discharge on some important characteristics of river. Select the correct option with respect to the peaks A and B.

The diagram given below represents the histology of a stripped muscle . Label the parts A, B, C, D, E and F.

Given below is one of the types of ecological pyramids. This type represents:

The graph given below represents the effect of sewage discharge of some important characteristics of river Select the CORRECT option with respect to peaks A and B.

NCERT FINGERTIPS ENGLISH-ENVIRONMENTAL ISSUES-Environmental Issues
  1. Write a short note on Joint Forest Management.

    Text Solution

    |

  2. The given graph shows how much nitrate (NO(3)^(-)) is exported from th...

    Text Solution

    |

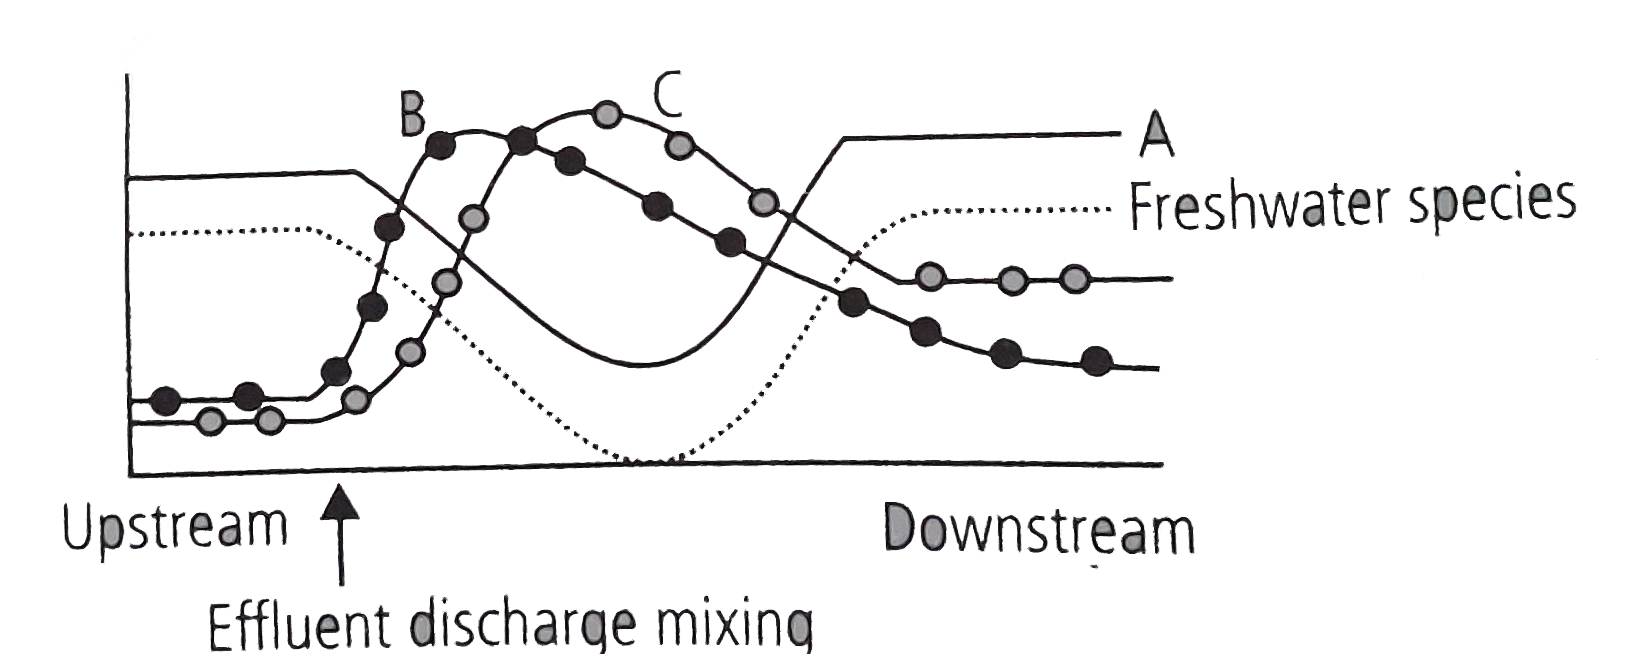
  3. The graph given below represents changes in different ecological param...

    Text Solution

    |

  4. The concentration of polychlorinated biphenyls (PCB, an organochloride...

    Text Solution

    |

  5. In the event of global warming, which one of the following is most lik...

    Text Solution

    |

  6. In the human-induced process called acid precipitation, the main bioge...

    Text Solution

    |

  7. Non-biodegradable pollutants are created by

    Text Solution

    |

  8. According to the Central Pollution Control Board, particles that are r...

    Text Solution

    |

  9. The material generally used for sound proffing of rooms like a recordi...

    Text Solution

    |

  10. Compressed Natural Gas (CNG) is

    Text Solution

    |

  11. World's most problematic aquatic weed is

    Text Solution

    |

  12. Which of the following causes biomagnification ?

    Text Solution

    |

  13. The expanded form of DDT is

    Text Solution

    |

  14. Which of the following materials takes the longest time for biodegrada...

    Text Solution

    |

  15. Chosse the incorrect statement.

    Text Solution

    |

  16. Among the following which one causes more indoor chemical pollution ?

    Text Solution

    |

  17. The green scum seen in the freshwater bodies is

    Text Solution

    |

  18. The loudness of a sound that a person can withstand without discomfort...

    Text Solution

    |

  19. The major source of noise pollution, worldwide is due to

    Text Solution

    |

  20. Match correctly the following and choose the correct option. {:("Env...

    Text Solution

    |