Home
Class 11
PHYSICS
Which of the following graphs represent ...

Which of the following graphs represent the behaviour of an ideal gas ?

A

1.

B

2.

C

3.

D

4.

Text Solution

AI Generated Solution

The correct Answer is:
To determine which graph represents the behavior of an ideal gas, we can analyze the options based on the Ideal Gas Law, which is expressed as: \[ PV = nRT \] Where: - \( P \) = Pressure - \( V \) = Volume - \( n \) = Number of moles of gas - \( R \) = Ideal gas constant - \( T \) = Temperature ### Step-by-Step Solution: 1. **Understand the Ideal Gas Law**: - The equation \( PV = nRT \) shows the relationship between pressure, volume, and temperature for an ideal gas. 2. **Analyze Option 1**: - The graph shows \( P \) vs \( T \) with \( V \) held constant. - Rearranging the Ideal Gas Law for constant \( V \) gives \( P \propto T \). - This indicates a linear relationship, which can be represented as \( P = kT \) (where \( k \) is a constant). - This graph will be a straight line passing through the origin. - **Conclusion**: This graph represents the behavior of an ideal gas. 3. **Analyze Option 2**: - The graph shows \( PV \) vs \( T \). - From the Ideal Gas Law, if \( n \) and \( R \) are constants, then \( PV = nRT \) implies \( PV \) is directly proportional to \( T \). - However, if the graph does not pass through the origin, it does not represent a direct proportionality. - **Conclusion**: This graph does not represent the behavior of an ideal gas. 4. **Analyze Option 3**: - The graph shows \( P \) vs \( V \) with \( T \) held constant. - From the Ideal Gas Law, if \( T \) is constant, then \( PV = \text{constant} \). - This relationship describes a hyperbola, not a straight line. - **Conclusion**: This graph does not represent the behavior of an ideal gas. 5. **Analyze Option 4**: - The graph shows \( PV \) vs \( T \). - As established, \( PV \) should be a straight line when plotted against \( T \) if \( n \) and \( R \) are constant. - If the graph is curved, it does not represent a direct proportionality. - **Conclusion**: This graph does not represent the behavior of an ideal gas. ### Final Answer: - **Option 1** is the only correct option that represents the behavior of an ideal gas.

To determine which graph represents the behavior of an ideal gas, we can analyze the options based on the Ideal Gas Law, which is expressed as: \[ PV = nRT \] Where: - \( P \) = Pressure - \( V \) = Volume - \( n \) = Number of moles of gas ...
Promotional Banner

Topper's Solved these Questions

  • KINETIC THEORY

    NCERT FINGERTIPS ENGLISH|Exercise Kinetic Theory of An Ideal Gas|18 Videos
  • KINETIC THEORY

    NCERT FINGERTIPS ENGLISH|Exercise LAW OF EQUIPARTITION OF ENERGY|5 Videos
  • KINETIC THEORY

    NCERT FINGERTIPS ENGLISH|Exercise Assertion And Reason|10 Videos
  • GRAVITATION

    NCERT FINGERTIPS ENGLISH|Exercise Assertion And Reason|15 Videos
  • LAWS OF MOTION

    NCERT FINGERTIPS ENGLISH|Exercise Assertion And Reason|15 Videos

Similar Questions

Explore conceptually related problems

Which of the following graphs represents exothermic reaction ?

Which of the following graphs represents exothermic reaction ?

Which of the following graph represents exothermic reaction ?

Which of the following graph represents uniform motion

Which of the following graph represents uniform motion

Which of the following graph represents Boyle's law ?

Which of the following graphs represents exothoermic reaction?

Which of the following graphs represents the correct Boyle's law ?

Which of the following graph represents the variation of amount of chemisorption of a gas by a solid with temperature under constant pressure?

NCERT FINGERTIPS ENGLISH-KINETIC THEORY-BEHAVIOUR OF GASES
  1. A real gas behaves like an ideal gas if its

    Text Solution

    |

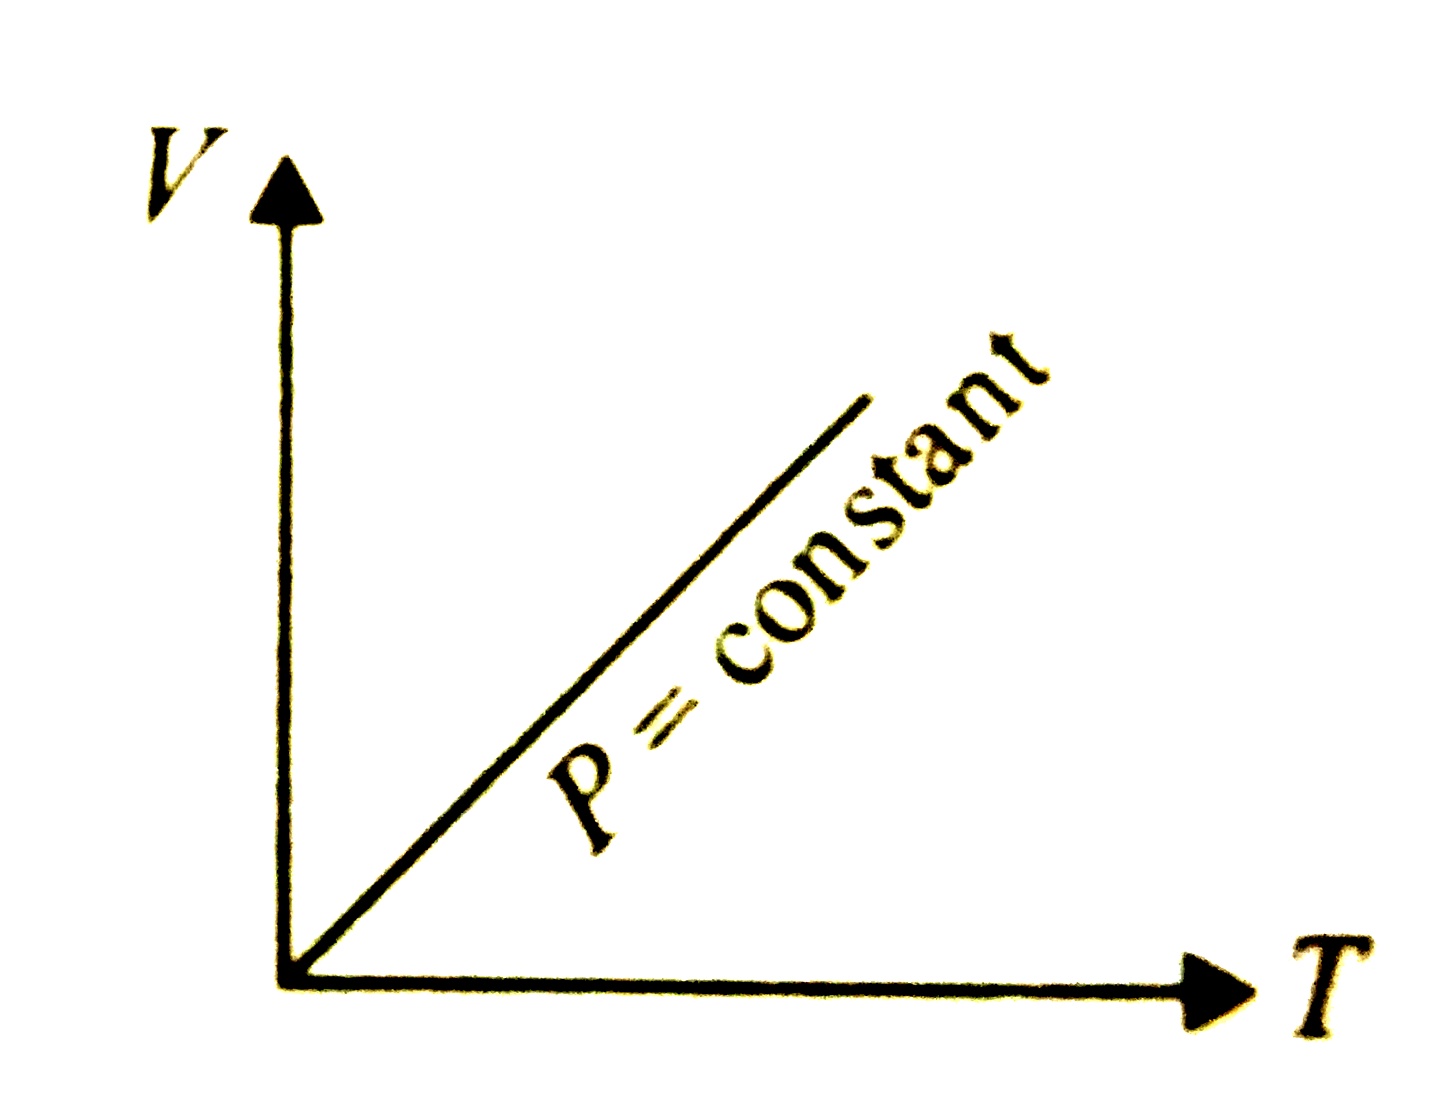
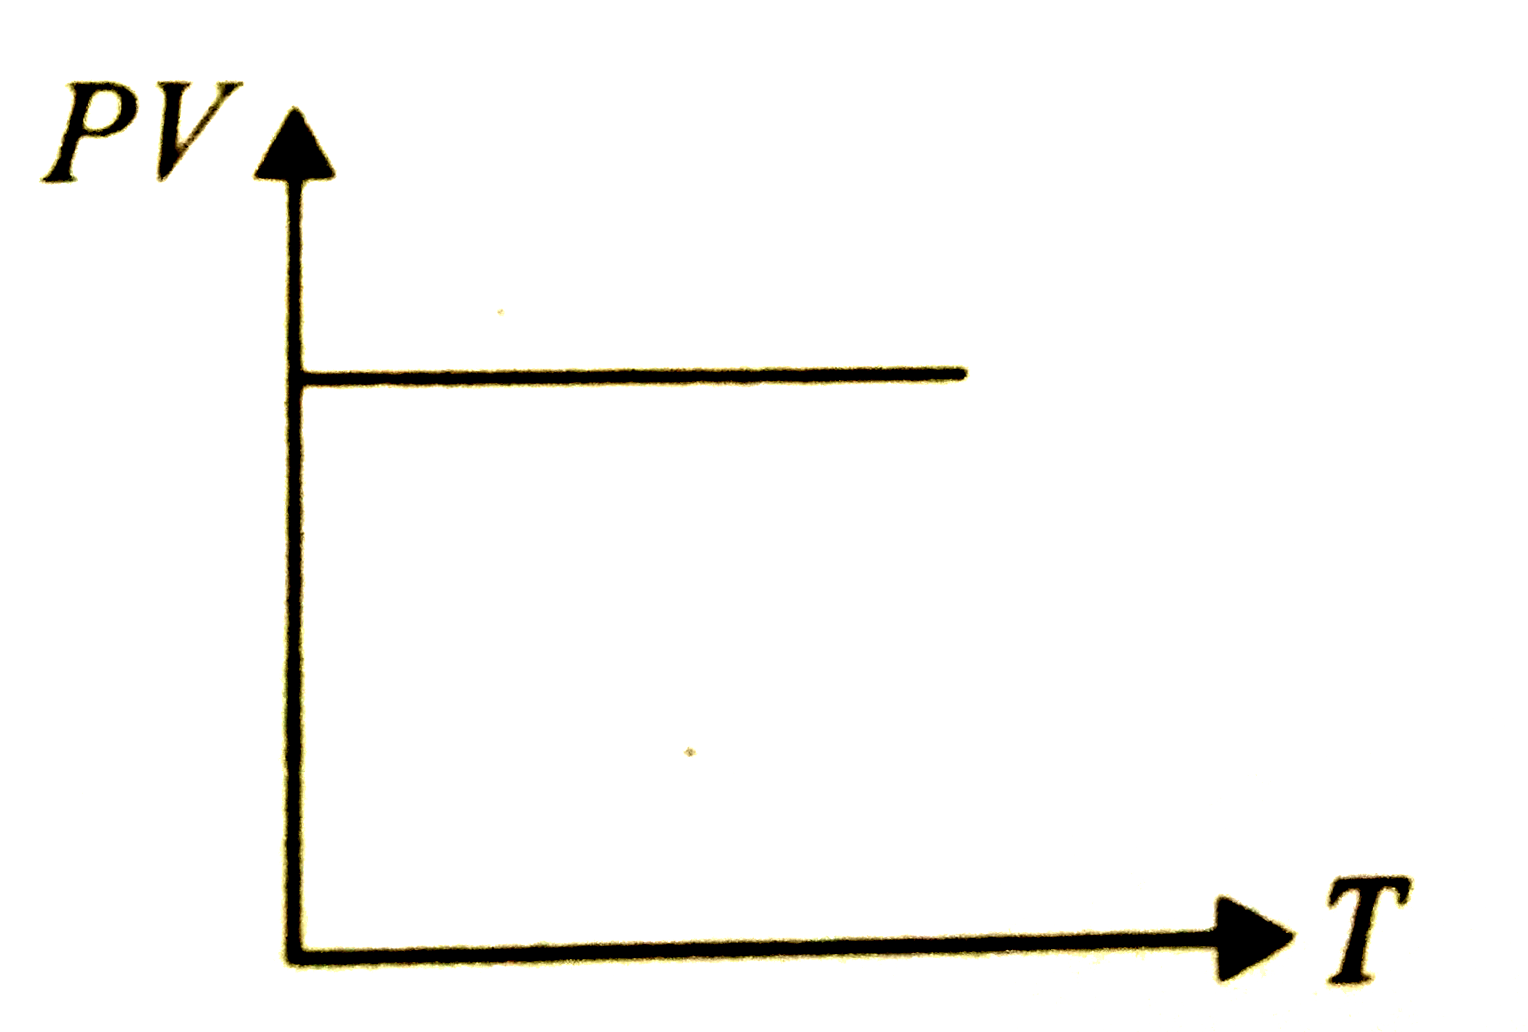
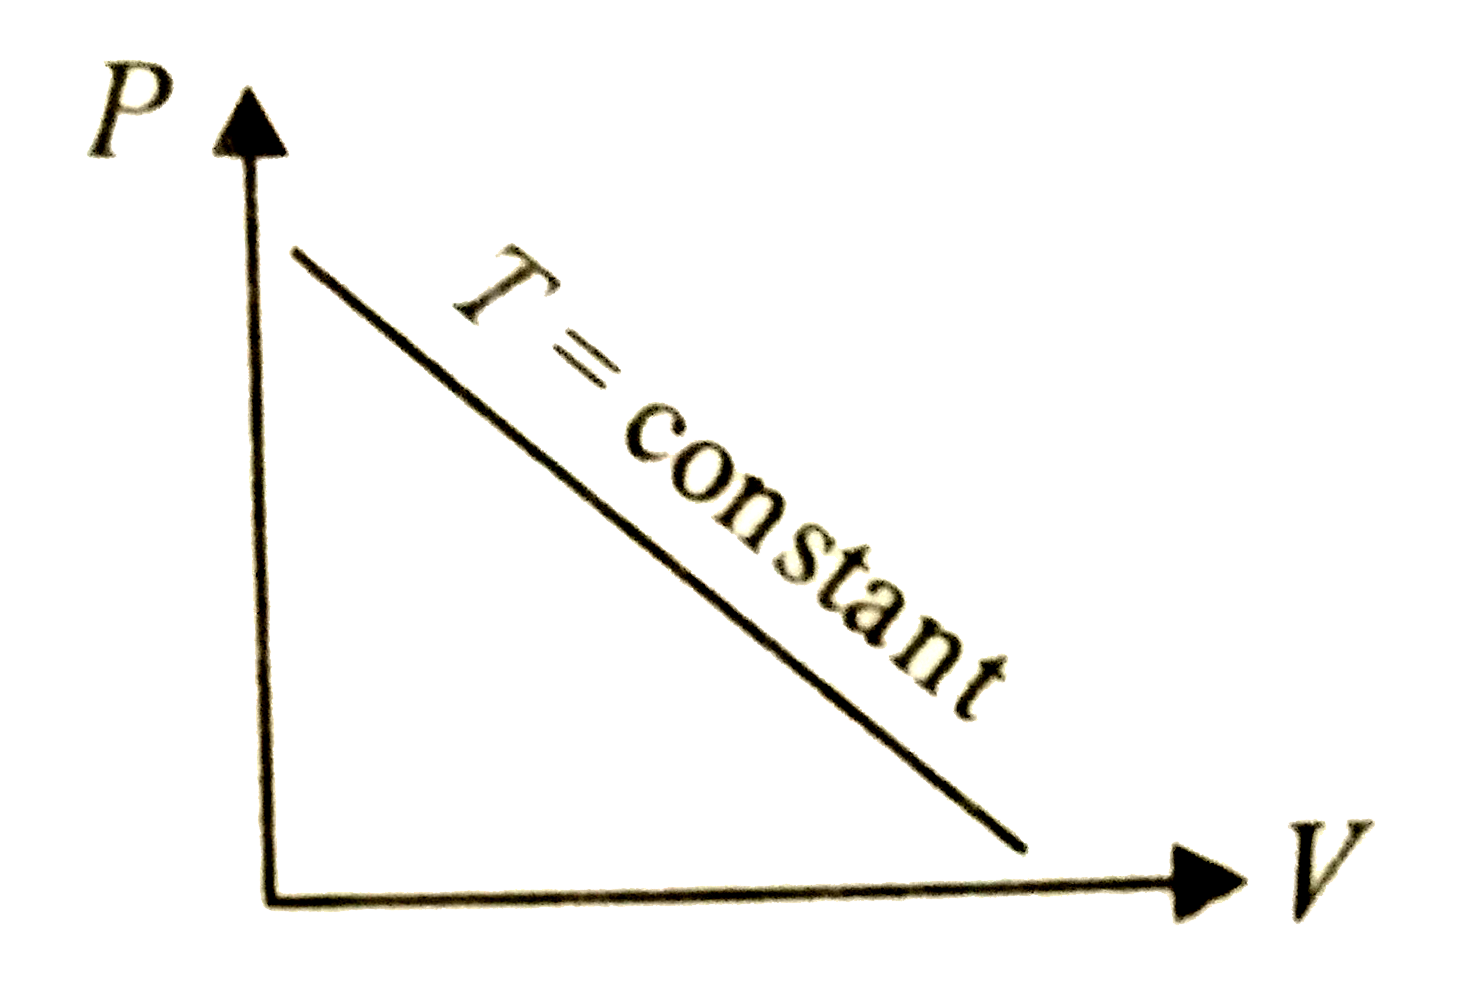
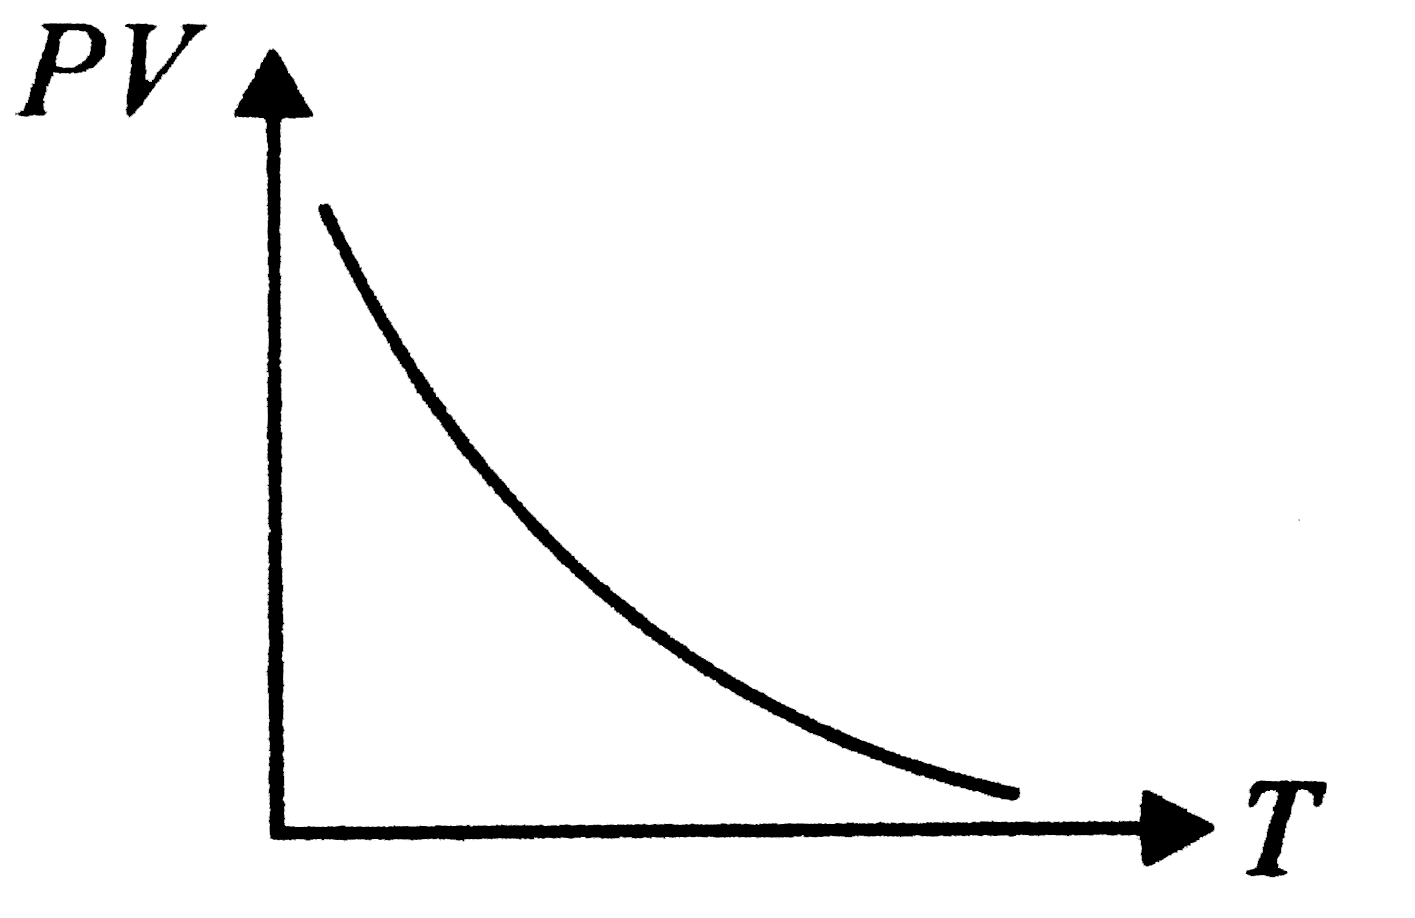
  2. Which of the following graphs represent the behaviour of an ideal gas ...

    Text Solution

    |

  3. If the pressure and the volume of certain quantity of ideal gas are ha...

    Text Solution

    |

  4. An air bubble of volume 1.0 cm^(3) rises from the bottom of a lake 40 ...

    Text Solution

    |

  5. The diameter of an oxygen molecule is 3 Ã… The ratio of molecular volu...

    Text Solution

    |

  6. A balloon contains 1500 m^(3) of helium at 27^(@)C and 4 atmospheric p...

    Text Solution

    |

  7. Pressure versus temperature graph of an ideal gas of equal number of m...

    Text Solution

    |

  8. Given is the graph between (PV)/T and P for 1 gm of oxygen gas at two ...

    Text Solution

    |

  9. A vessel has 6gm of oxygen at pressure P and temperature 400 K.A smal...

    Text Solution

    |

  10. A vessel has 6g of hydrogen at pressure P and temperature 500K. A smal...

    Text Solution

    |

  11. A vessel contains two non-reactive gases neon (monoatomic) and oxygen ...

    Text Solution

    |

  12. A cylinder contained 10kgof gas at pressure 10^(7) N / m^(2). The quan...

    Text Solution

    |

  13. A gas at 300 K has pressure 4 xx 10^(-10) N//m^(2). IF k = 1.38 xx 10^...

    Text Solution

    |

  14. The volume of vessel A is twice the volume of another vessel B and bot...

    Text Solution

    |

  15. When the temperature of a gas, filled in a closed vessel is increased ...

    Text Solution

    |

  16. The equation of state for 5 g of oxygen at a pressure P and temperatur...

    Text Solution

    |

  17. A vessel contains 1 mole of O2 gas (relative molar mass 32) at a tempe...

    Text Solution

    |

  18. In a certain region of space there are only 5 gaseous molecules per cm...

    Text Solution

    |

  19. A sample of an ideal gas occupies a volume V at pressure P and absolut...

    Text Solution

    |

  20. One half mole each of nitrogen, oxygen and carbon dioxide are mixed in...

    Text Solution

    |