A
B
C
D
Text Solution
AI Generated Solution
The correct Answer is:


Topper's Solved these Questions
THERMAL PROPERTIES OF MATTER
NCERT FINGERTIPS ENGLISH|Exercise Specific Heat|5 VideosTHERMAL PROPERTIES OF MATTER
NCERT FINGERTIPS ENGLISH|Exercise Calorimetery|4 VideosTHERMAL PROPERTIES OF MATTER
NCERT FINGERTIPS ENGLISH|Exercise Measurement of Temperature|2 VideosSYSTEM OF PARTICLES AND ROTATIONAL MOTIONS
NCERT FINGERTIPS ENGLISH|Exercise NCERT Exemplar|8 VideosTHERMODYNAMICS
NCERT FINGERTIPS ENGLISH|Exercise Assertion And Reason|15 Videos
Similar Questions
Explore conceptually related problems
NCERT FINGERTIPS ENGLISH-THERMAL PROPERTIES OF MATTER-Thermal Expansion
- The volume of a block of a metal changes by 0.12% when it is heated th...
Text Solution
|
- There is a hole in the middle of a copper plate . When heating the pla...
Text Solution
|
- Length of wire at room temperature is 4.55 m , when the temperature i...
Text Solution
|
- To increase the length of brass rod by 2% its temperature should incre...
Text Solution
|
- At 50^(@)C , a brass rod has a length 50 cm and a diameter 2 mm . It...
Text Solution
|
- The moment of inertia of a rod about its perpendicular bisector is I ....
Text Solution
|
- A brass wire 1.8 m long at 27^(@)C is held taut with negligible tensi...
Text Solution
|
- The coeefficient of volume expansion of liquid is gamma. The fr...
Text Solution
|
- A rectangular block is heated from 0^(@)C to 100^(@)C. The percentag...
Text Solution
|
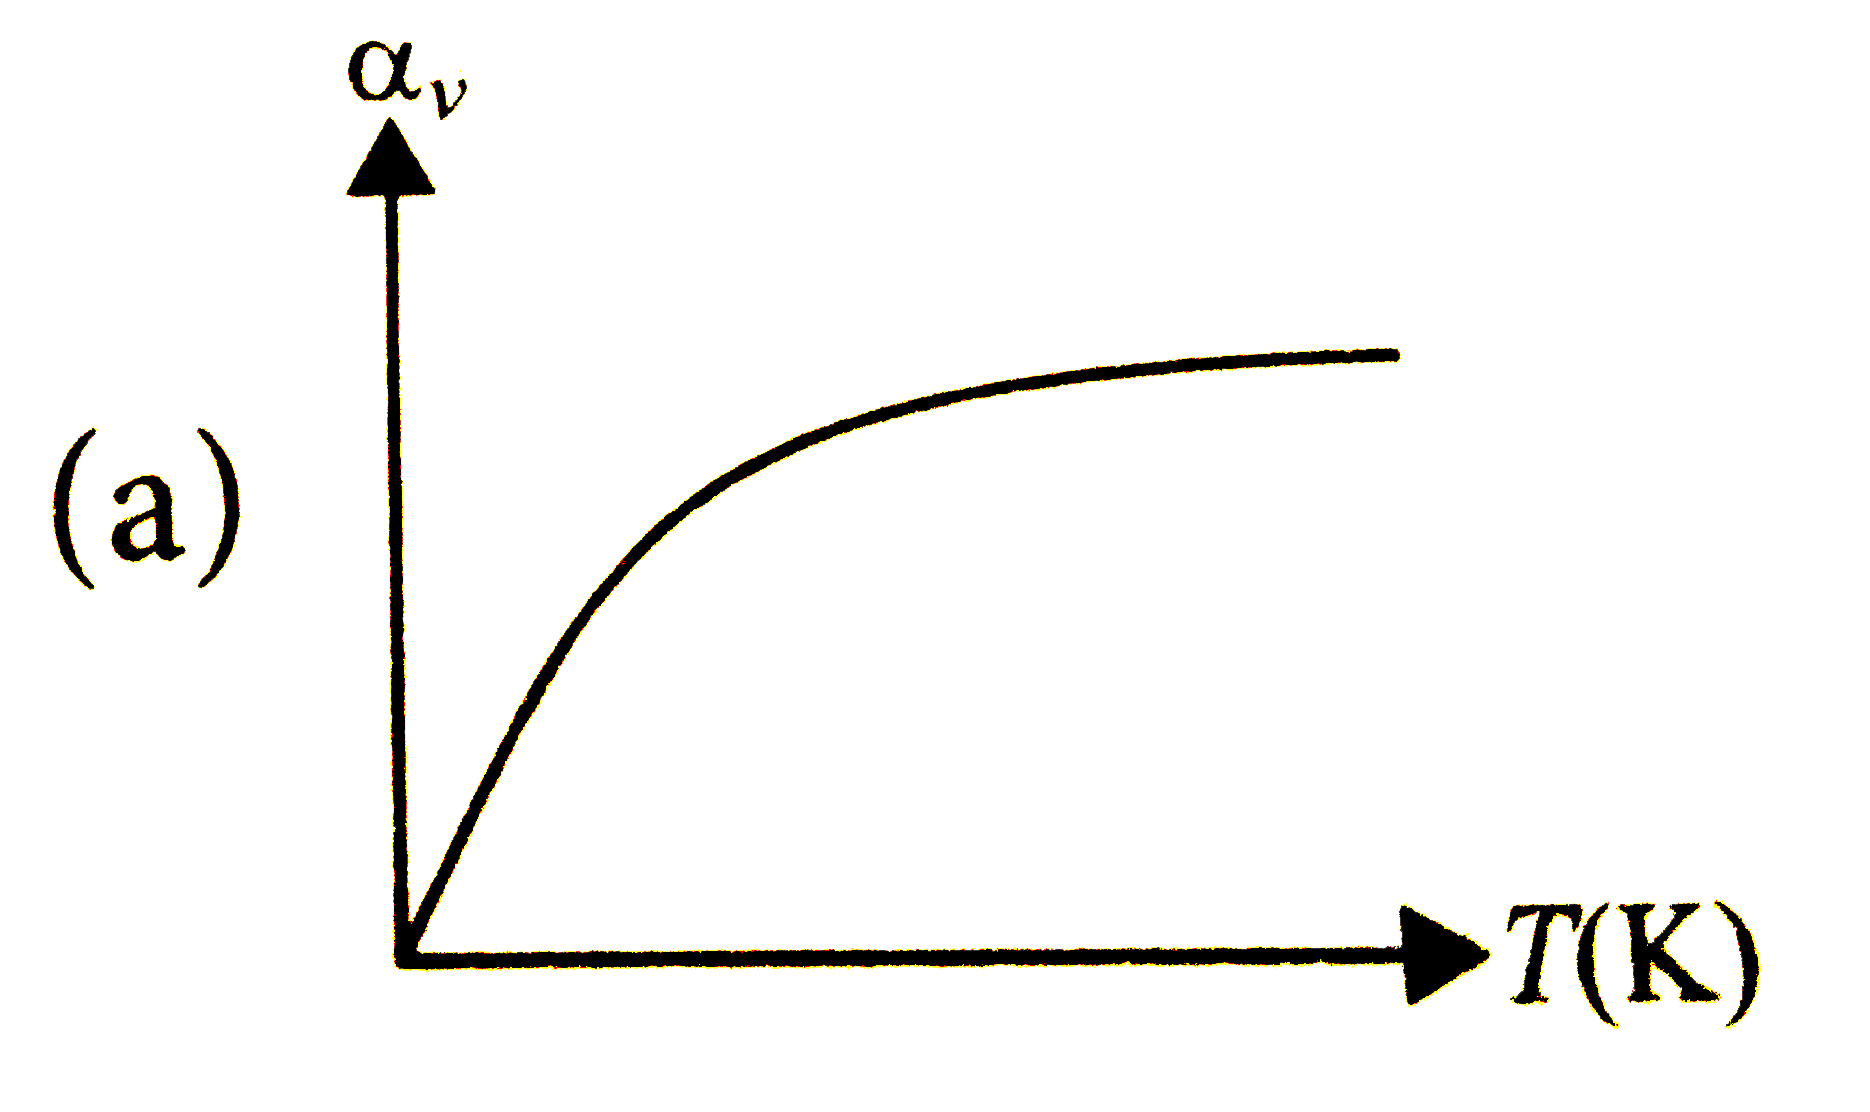
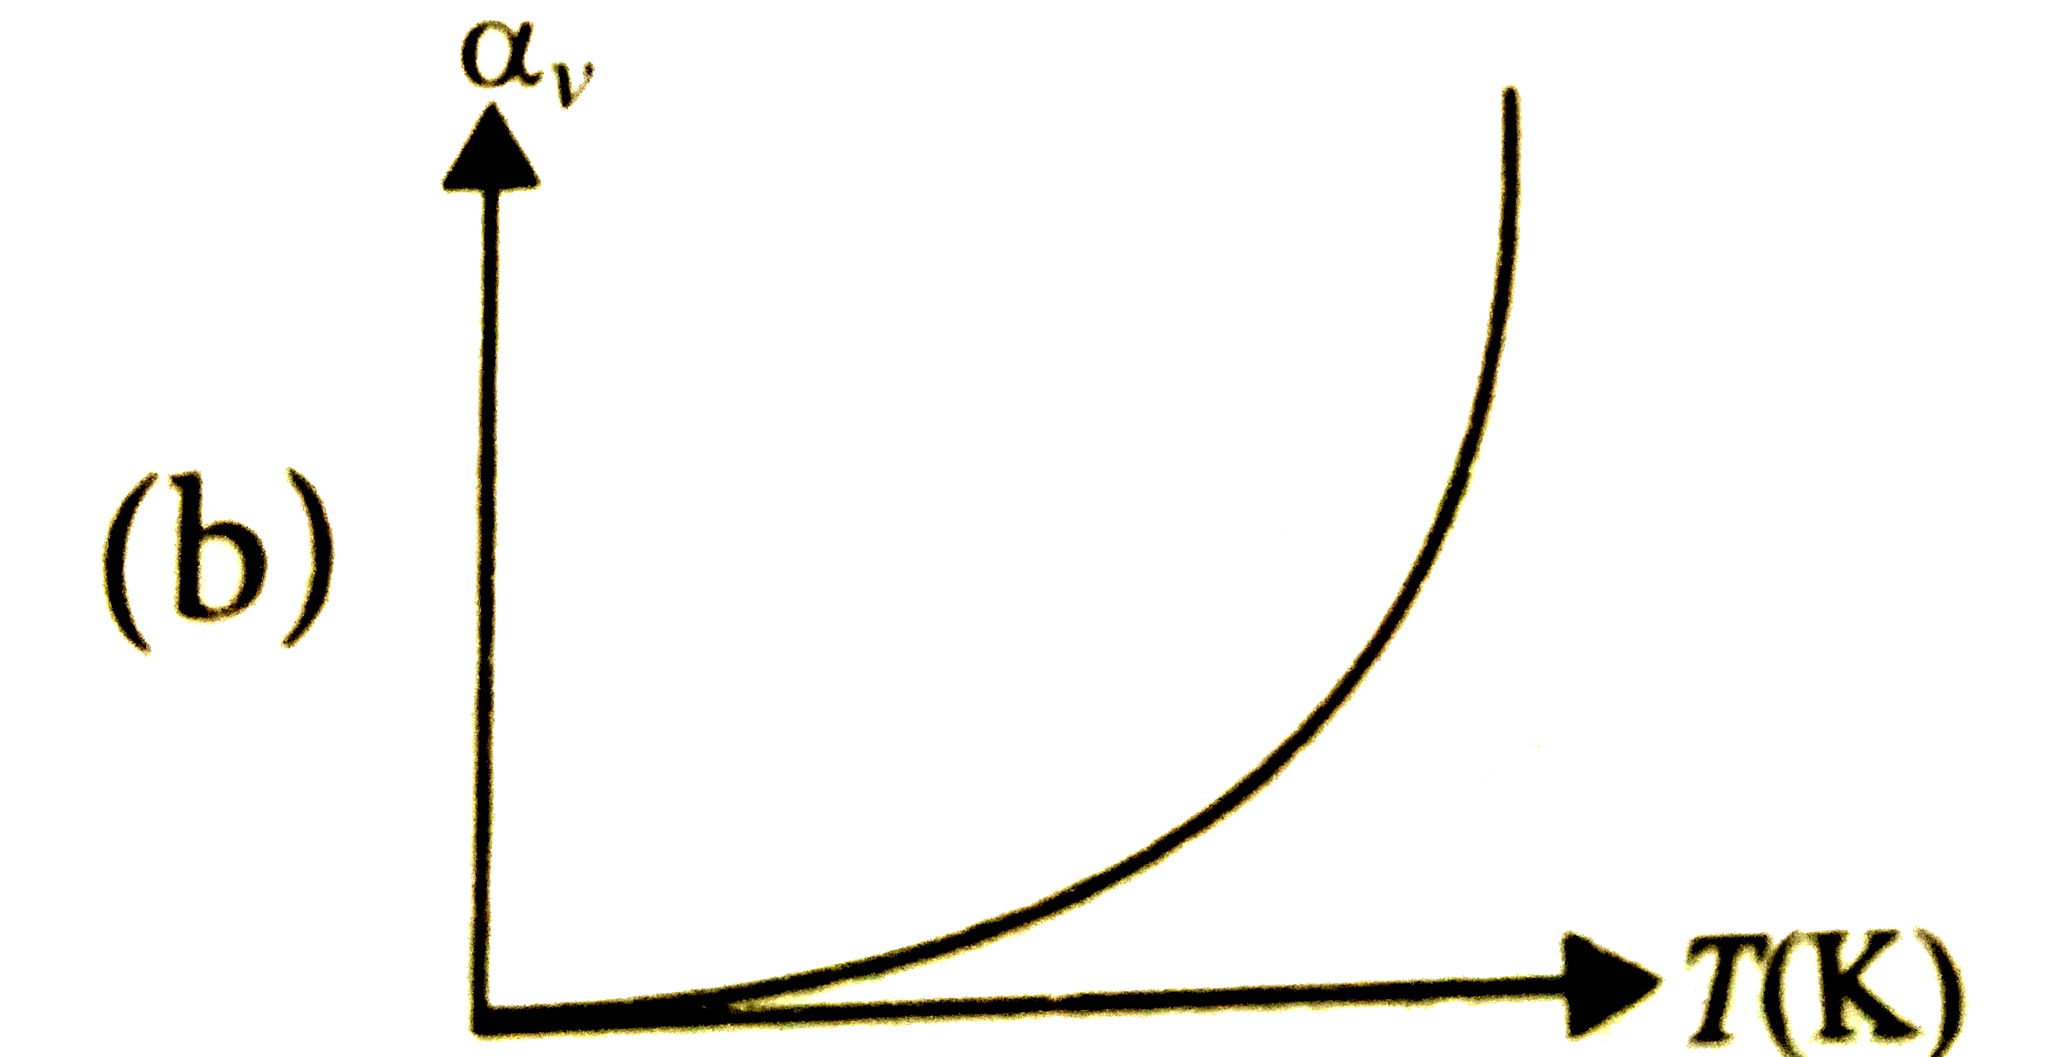
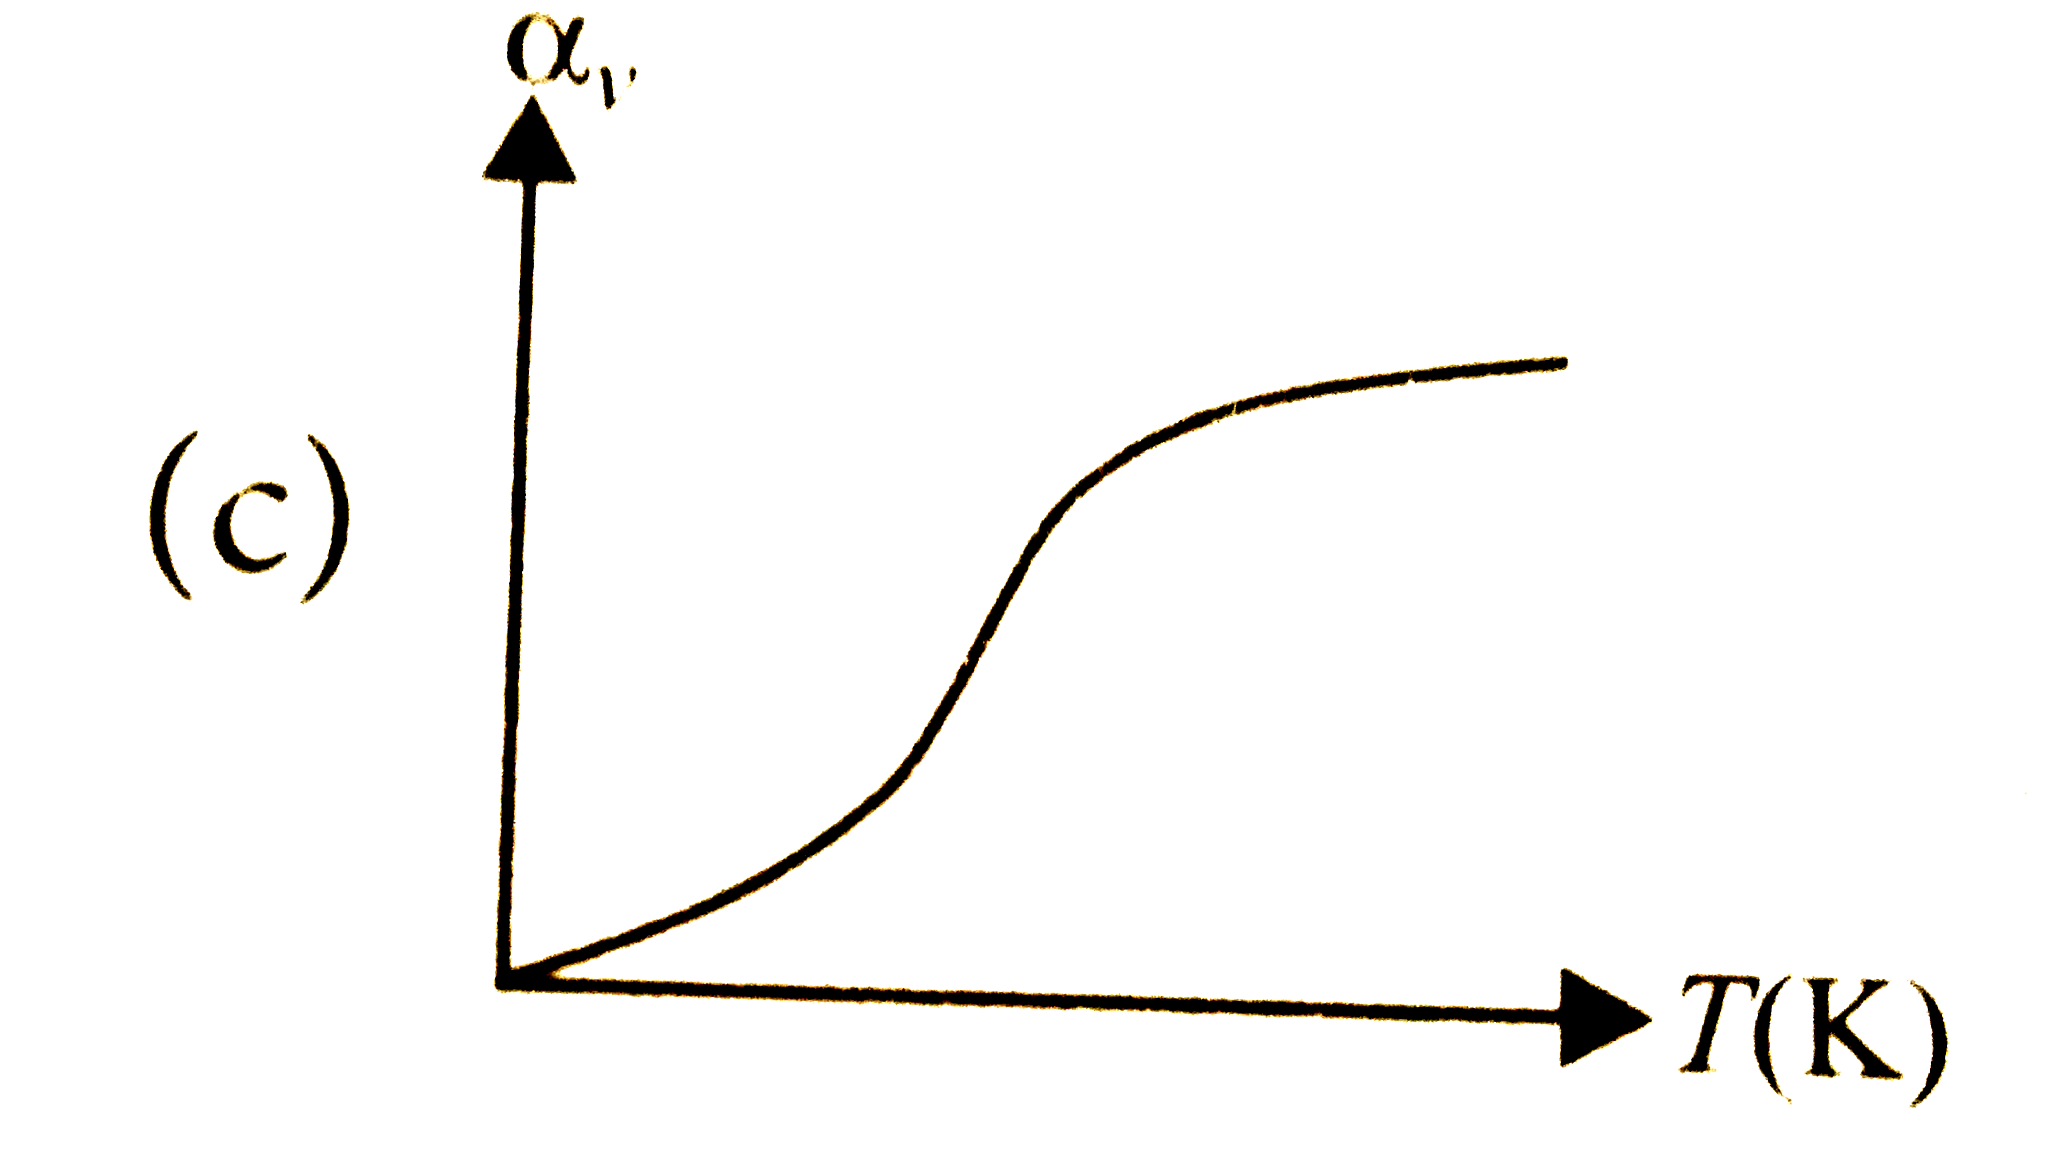
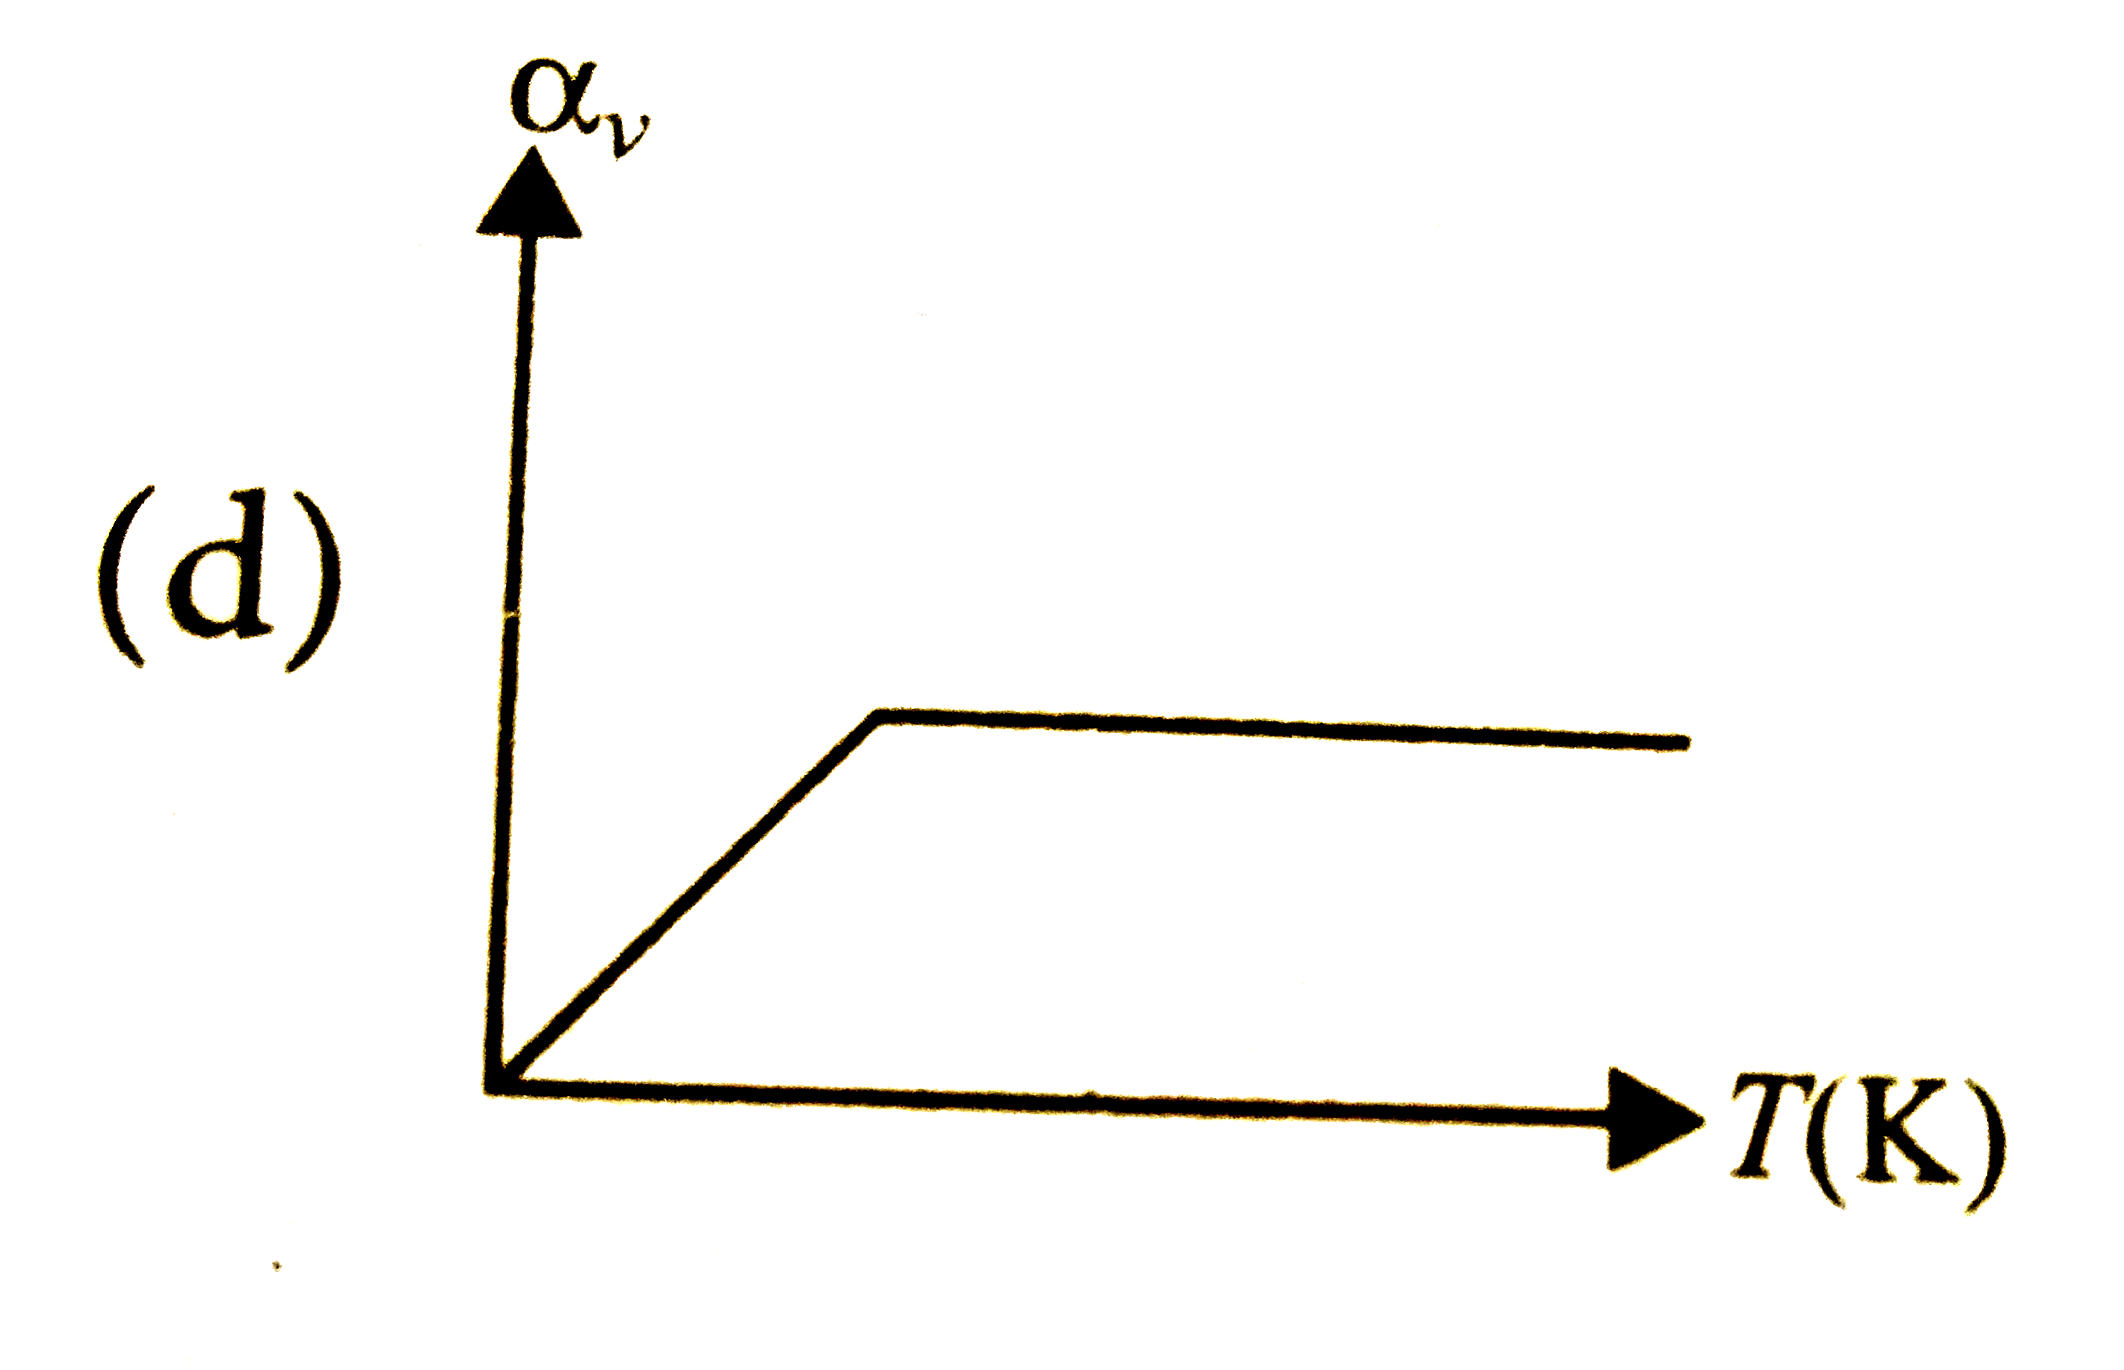
- Which of the following graphs correctly shows variation of coefficie...
Text Solution
|
- If alpha, beta and gamma coefficient of linear, superficial and vol...
Text Solution
|
- Two spheres A and B are made of the same material and have the same...
Text Solution
|
- The volume of a metal sphere increases by 0.24% when its temperature i...
Text Solution
|
- Calculate the stress developed inside a tooth cavity filled with coppe...
Text Solution
|
- Which of the following graph shows the variationi of density of wat...
Text Solution
|