A
B
C
D
Text Solution
Verified by Experts
The correct Answer is:


Topper's Solved these Questions
CURRENT ELECTRICITY
NCERT FINGERTIPS ENGLISH|Exercise DRIFT OF ELECTRONS|2 VideosCURRENT ELECTRICITY
NCERT FINGERTIPS ENGLISH|Exercise LIMITATIONS OF OHM S LAW|4 VideosCURRENT ELECTRICITY
NCERT FINGERTIPS ENGLISH|Exercise ELECTRIC CURRENT IN CONDUCTORS|2 VideosCOMMUNITCATION SYSTEMS
NCERT FINGERTIPS ENGLISH|Exercise Assertion And Reason|30 VideosDUAL NATURE OF RADIATION AND MATTER
NCERT FINGERTIPS ENGLISH|Exercise Assertion And Reason|15 Videos
Similar Questions
Explore conceptually related problems
NCERT FINGERTIPS ENGLISH-CURRENT ELECTRICITY-OHM S LAW
- The electrical resistance of a conductor depends upon
Text Solution
|
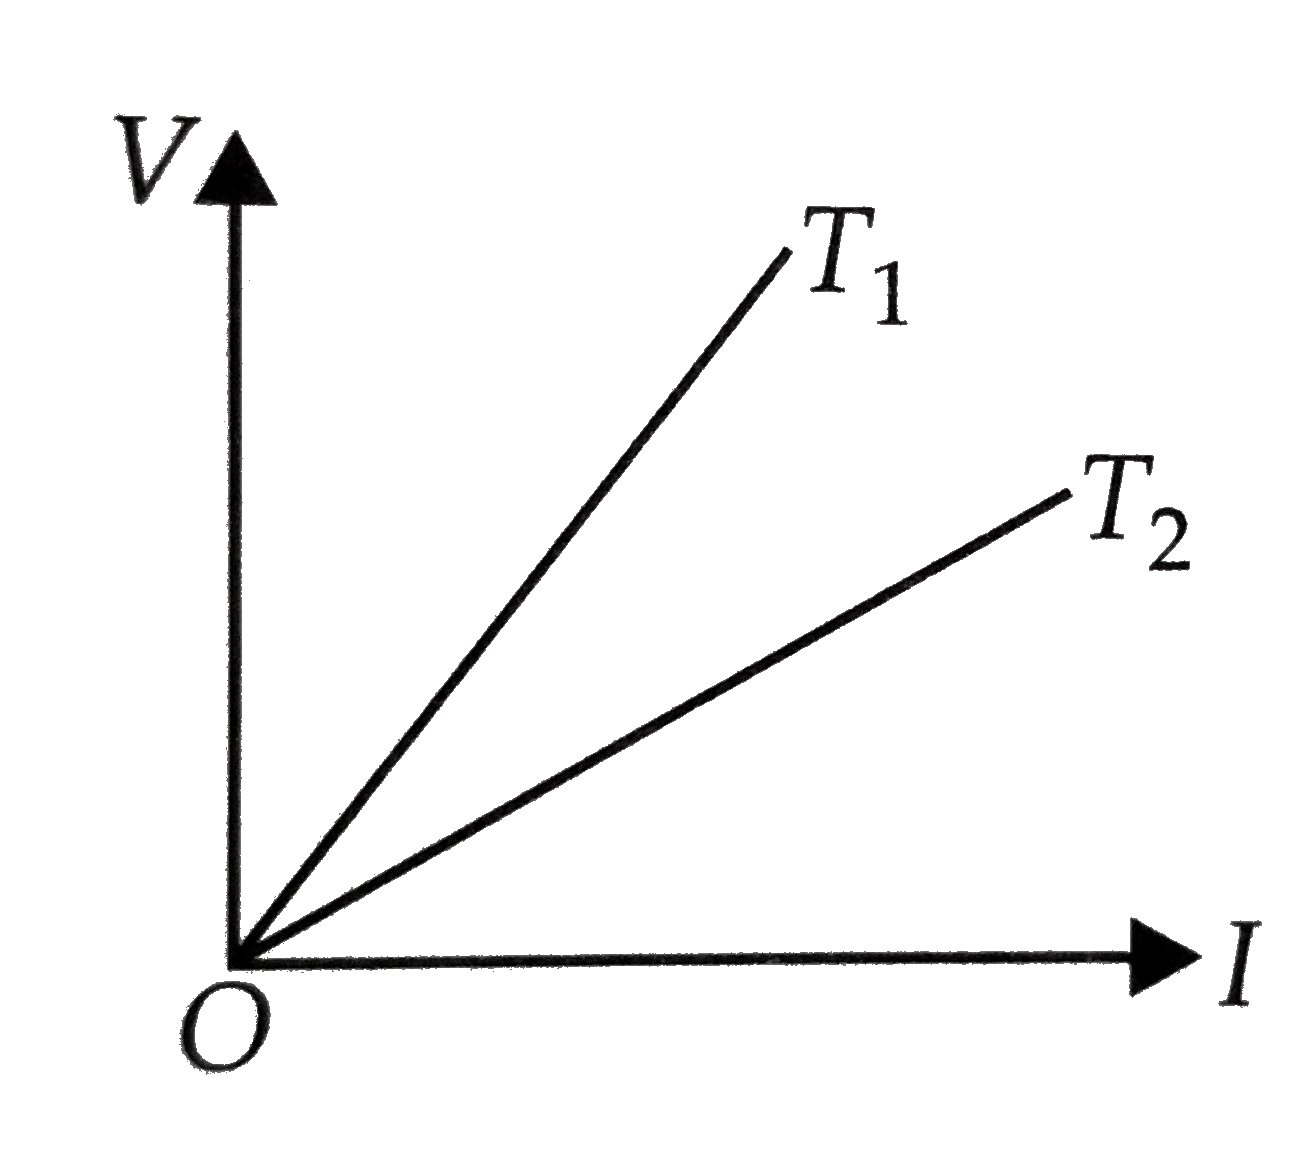
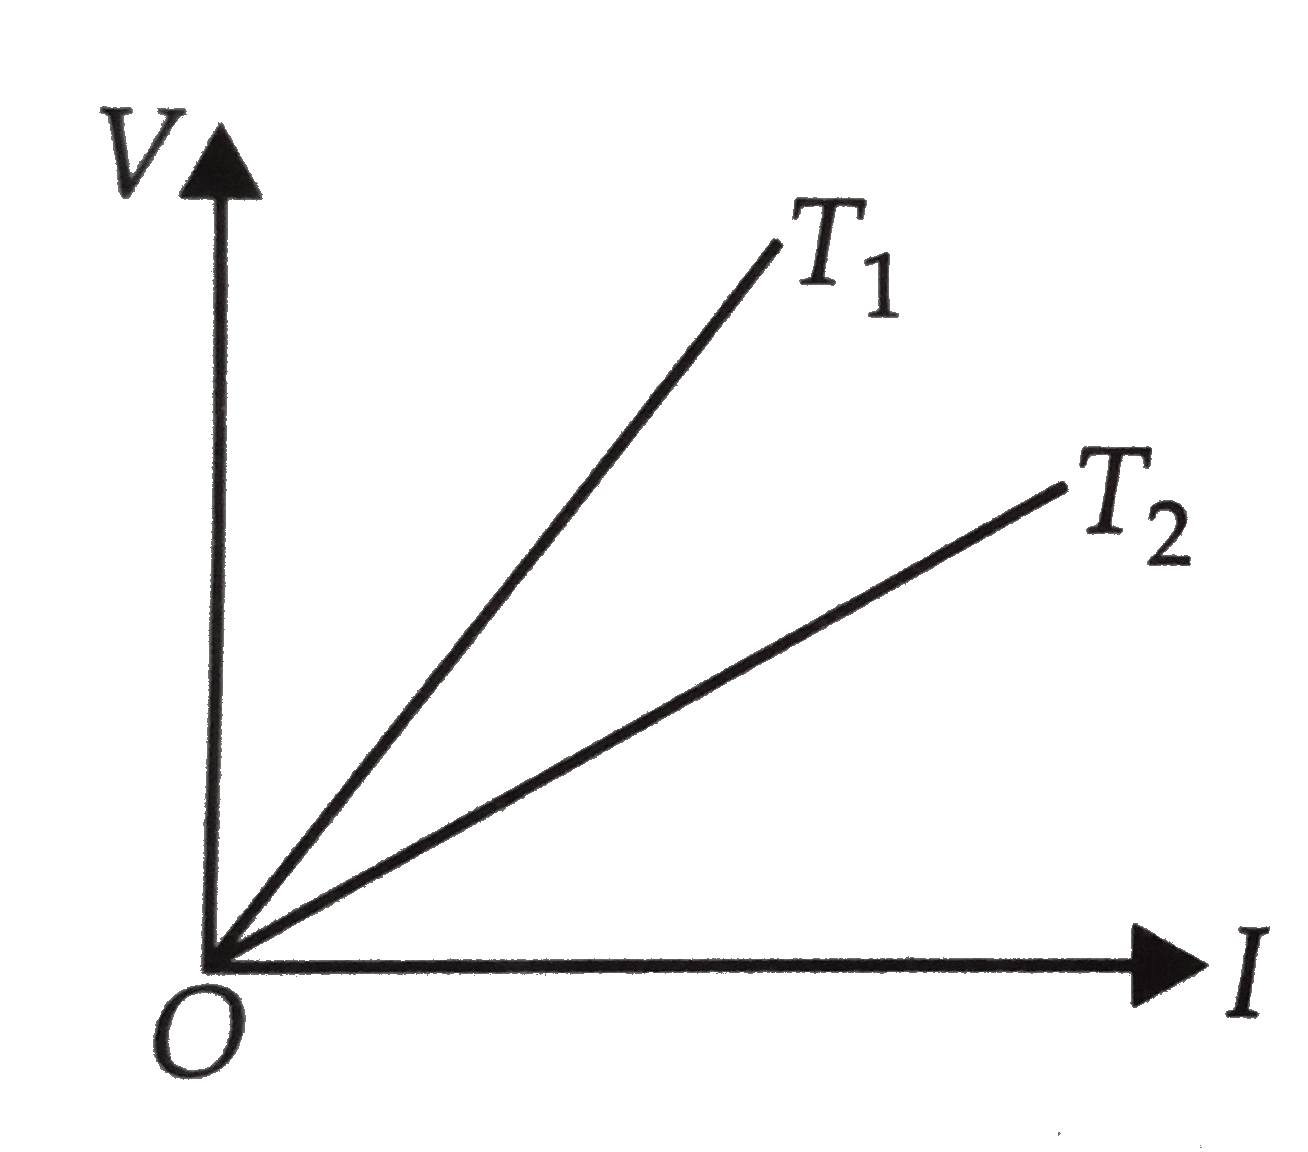
- The voltage V and current I v graphs for a conductor at two different ...
Text Solution
|
- A wire of resistance 4 Omega is used to wind a coil of radius 7 cm. Th...
Text Solution
|
- A cylindrical rod is reformed to half of its original length keeping v...
Text Solution
|
- A wire with 15ohm resistance is stretched by one tenth of its original...
Text Solution
|
- Space between tow concentric spheres of radii r(1) and r(2) such that ...
Text Solution
|
- The current density varies radical distance r as J=ar^(2), in a cylind...
Text Solution
|