A
B
C
D
Text Solution
Verified by Experts
The correct Answer is:


Topper's Solved these Questions
CURRENT ELECTRICITY
NCERT FINGERTIPS ENGLISH|Exercise ELECTRICAL ENERGY, POWER|8 VideosCURRENT ELECTRICITY
NCERT FINGERTIPS ENGLISH|Exercise COMBINED OF RESISTORS;|23 VideosCURRENT ELECTRICITY
NCERT FINGERTIPS ENGLISH|Exercise RESISTIVITY|7 VideosCOMMUNITCATION SYSTEMS
NCERT FINGERTIPS ENGLISH|Exercise Assertion And Reason|30 VideosDUAL NATURE OF RADIATION AND MATTER
NCERT FINGERTIPS ENGLISH|Exercise Assertion And Reason|15 Videos
Similar Questions
Explore conceptually related problems
NCERT FINGERTIPS ENGLISH-CURRENT ELECTRICITY-TEMPERATURE DEPENDENCE OF RESISTIVITY
- The resistance of a heating is 99Omega at room temperature. What is th...
Text Solution
|
- The resistance of the wire in the platinum resistance thermometer at i...
Text Solution
|
- The resistance of wire in a heater at room temperature is 65Oemga. Whe...
Text Solution
|
- A wire has a resistance of 2.5Omega at 28^(@)C and a resistance of 2.9...
Text Solution
|
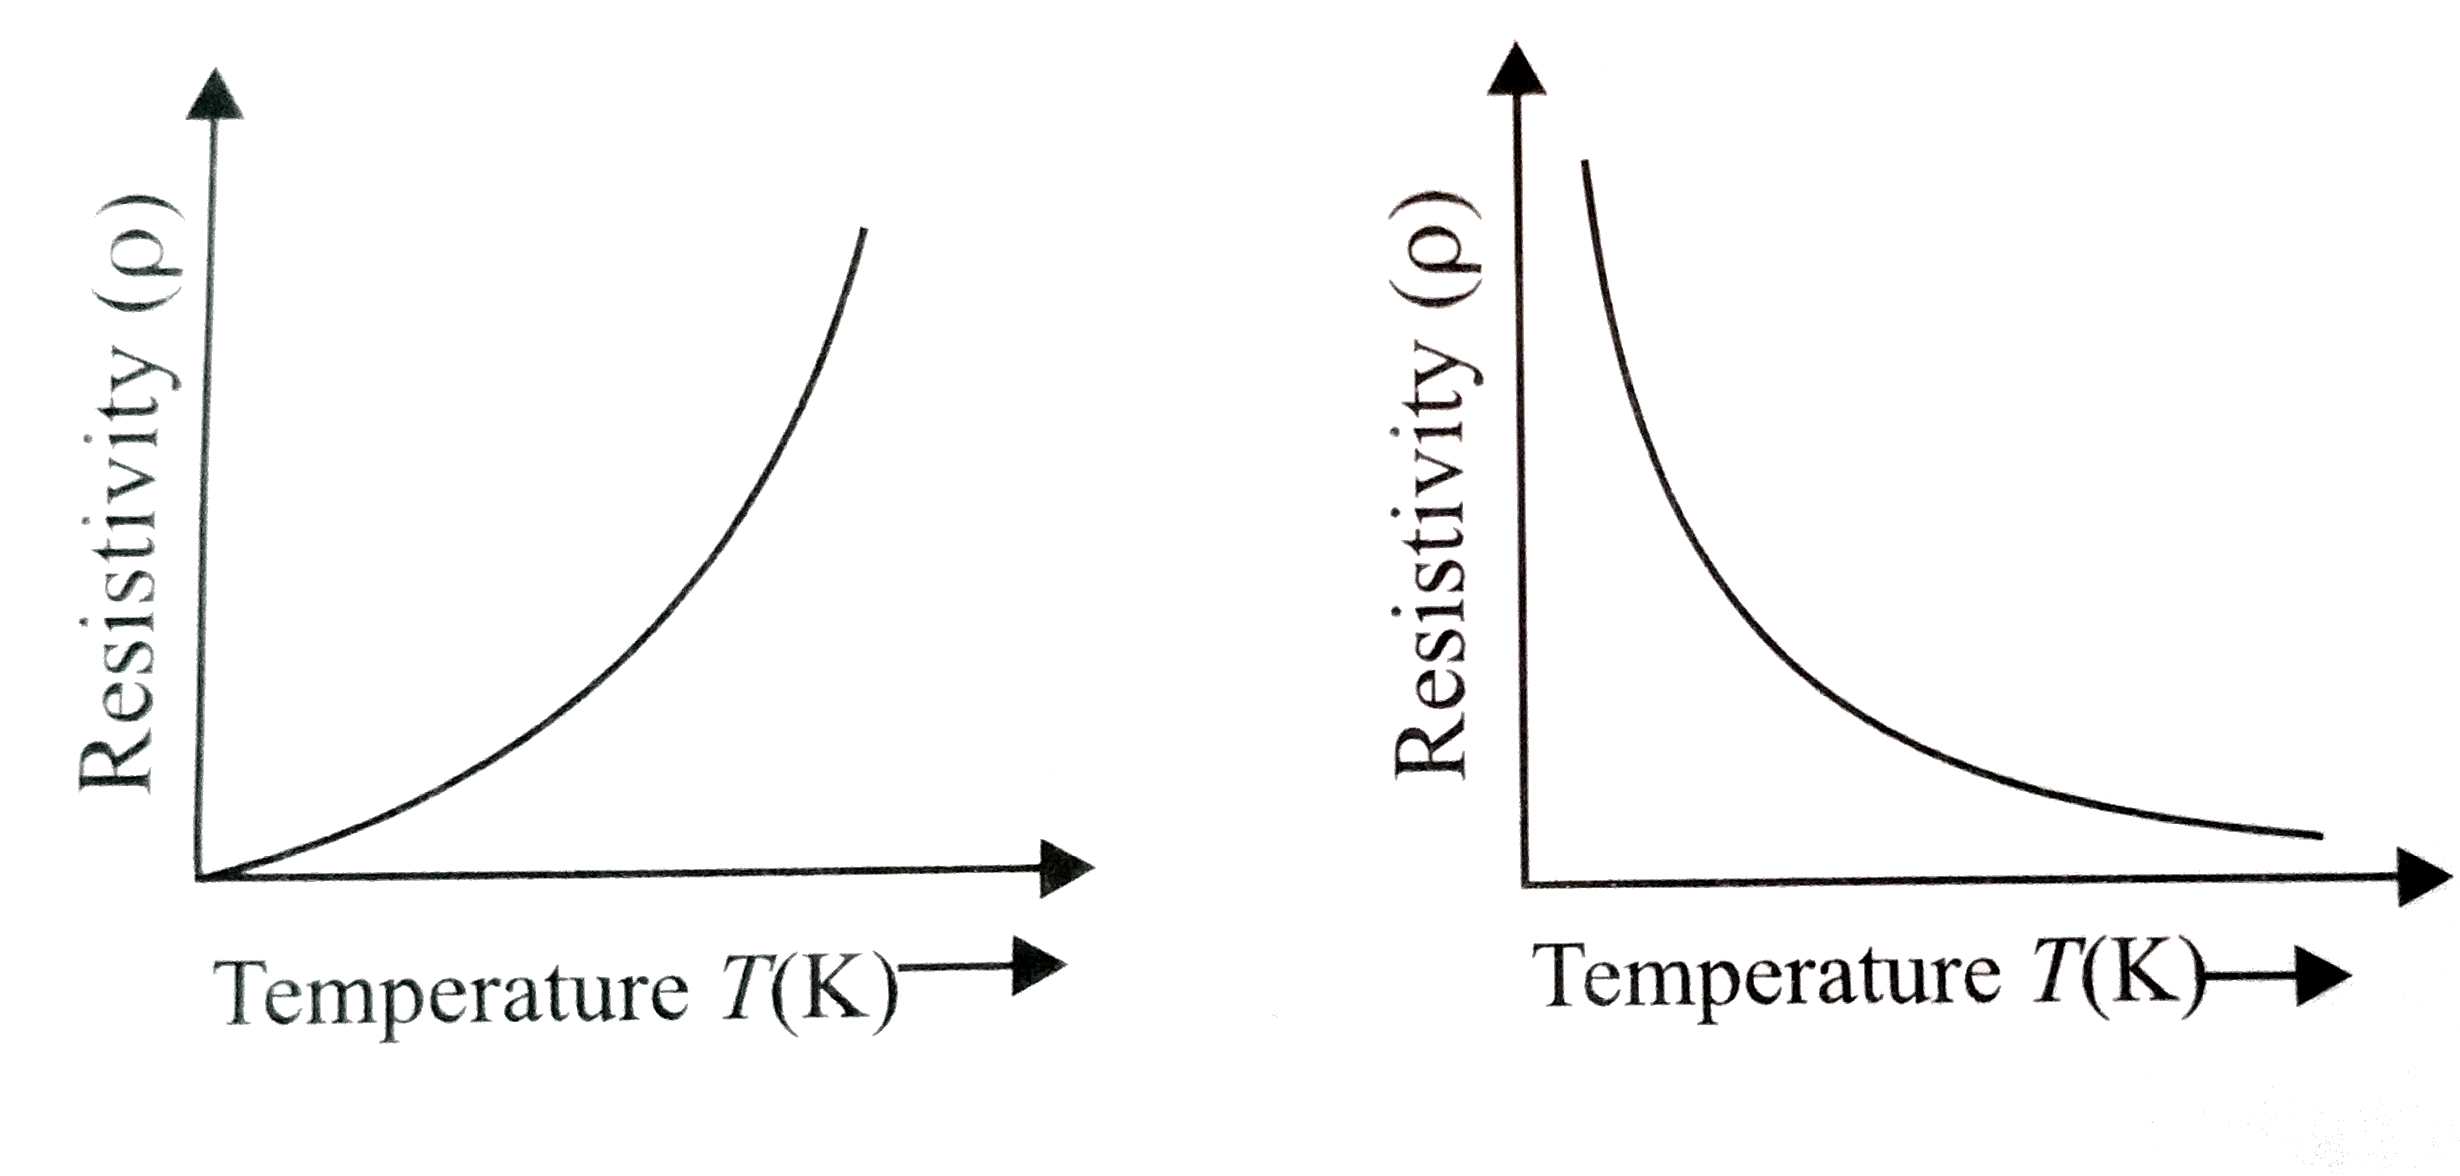
- Figure (a) and figure (b) both are showing the variation of resistivit...
Text Solution
|
- Why are constantan and manganin used for making standard resistances ?
Text Solution
|
- With increase in temperature of the conductivity of
Text Solution
|