A
B

C

D

Text Solution
AI Generated Solution
The correct Answer is:


Topper's Solved these Questions
Similar Questions
Explore conceptually related problems
NCERT FINGERTIPS ENGLISH-ALTERNATING CURRENT -Assertion And Reason
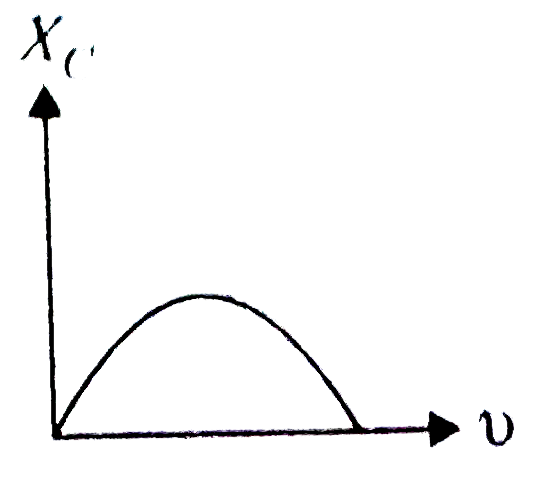
- Identify the graph which correctly reperesents the variation of capaci...
Text Solution
|
- Assertion : An alternating current does not show any magnetic effect. ...
Text Solution
|
- Assertion: Average value of AC over a complete cycle is always zero. ...
Text Solution
|
- Assertion : The capacitive reactance limits the amplitude of the curre...
Text Solution
|
- Assertion : The inductive reactance limits amplitude of the current in...
Text Solution
|
- Assertion : In series LCR resonance circuit, the impedance is equal to...
Text Solution
|
- Assertion : In a purely inductive or capacitive circuit, the current i...
Text Solution
|
- Assertion : The only element that dissipates energy in an ac circuit i...
Text Solution
|
- Assertion : The power in ac circuit is minimum if the circuit has only...
Text Solution
|
- Assertion : Resonance is exhibited by a circuit only if both L and C a...
Text Solution
|
- Assertion : When a current flows in the coil of a transformer then its...
Text Solution
|
- Assertion : An ideal transformer does not vary the power. Reason : A...
Text Solution
|
- Assertion : A step-up transformer changes a low voltage into a high vo...
Text Solution
|
- Assertion : A given transformer can be used to step-up ot step-down th...
Text Solution
|
- Assertion : A laminated core is used in transformers to increase eddy ...
Text Solution
|
- Assertion : A transformer cannot work on dc supply. Reason : dc chan...
Text Solution
|