A
B
C
D
Text Solution
Verified by Experts
The correct Answer is:


Topper's Solved these Questions
PRACTICE PAPPER
NCERT FINGERTIPS ENGLISH|Exercise Practice Papper 2|50 VideosPRACTICE PAPPER
NCERT FINGERTIPS ENGLISH|Exercise Practice Papper 3|50 VideosNUCLEI
NCERT FINGERTIPS ENGLISH|Exercise Assertion And Reason|15 VideosRAY OPTICS AND OPTICAL INSTRUMENTS
NCERT FINGERTIPS ENGLISH|Exercise NCERT Exemplar|11 Videos
Similar Questions
Explore conceptually related problems
NCERT FINGERTIPS ENGLISH-PRACTICE PAPPER-Practice Paper 3
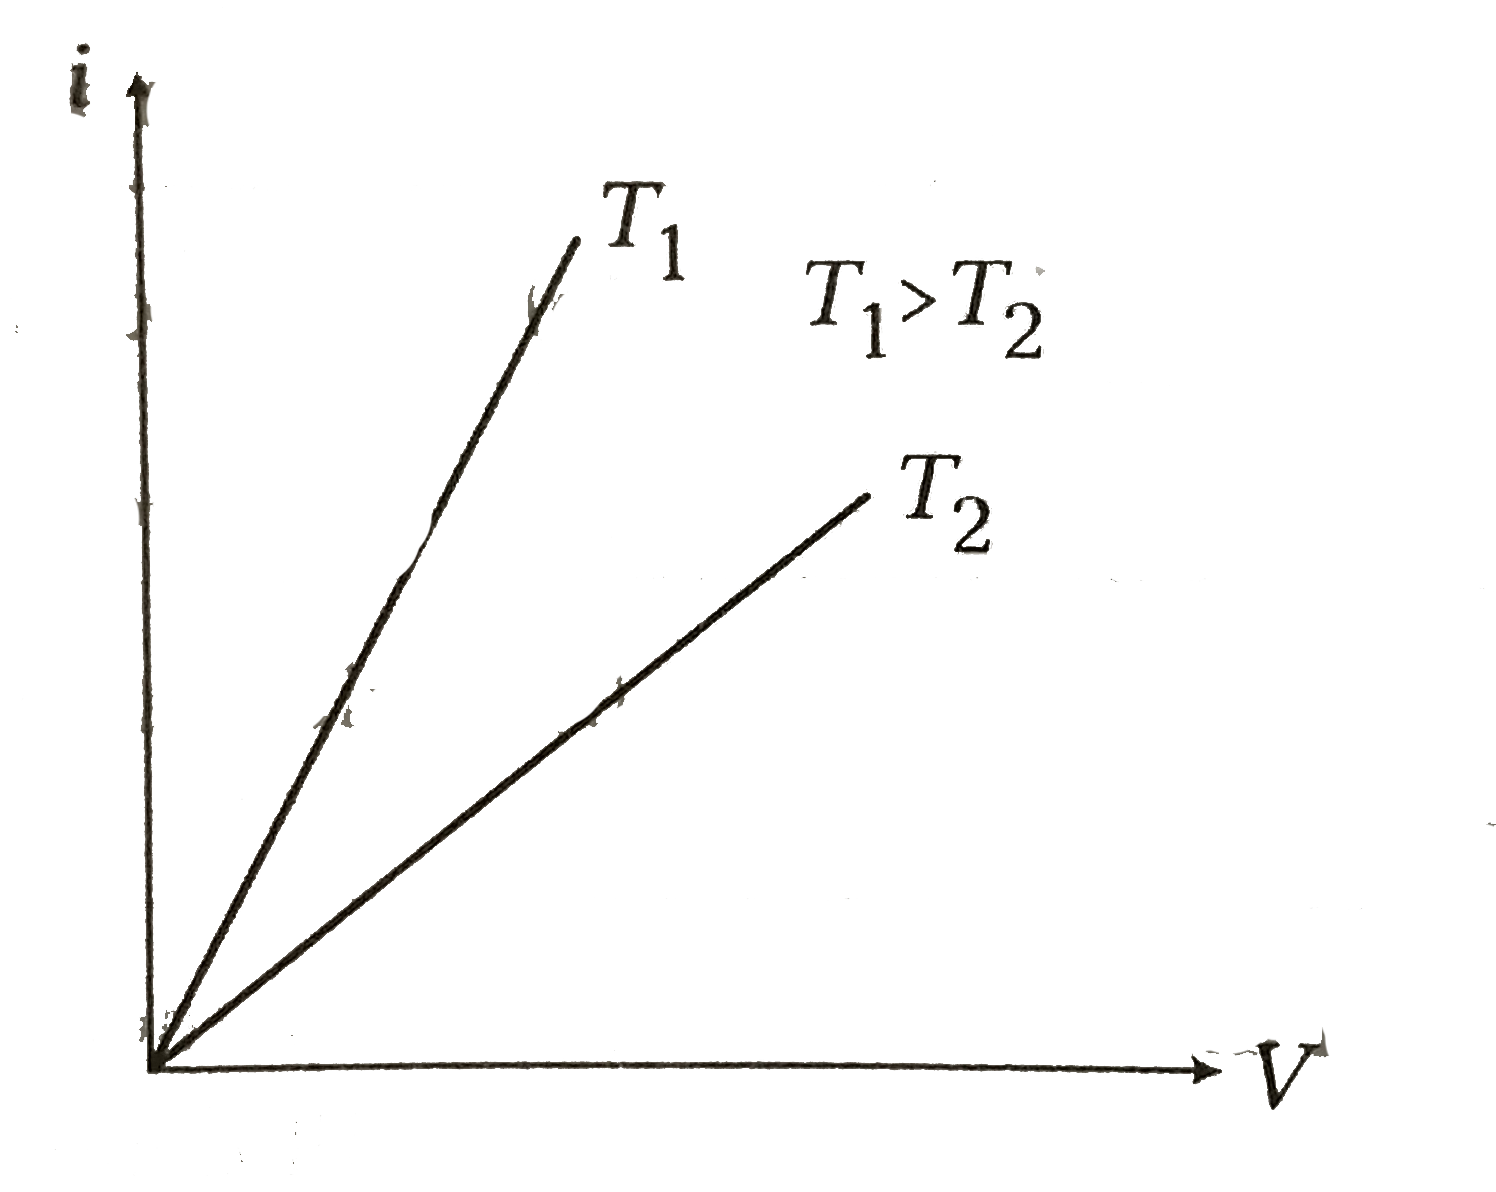
- Assertion : Current versus potential difference (i-V) graph for a cond...
Text Solution
|
- When a pentavalent imputrity is added in Ge crystal then, what type of...
Text Solution
|
- A thin metal plate P is inserted between the plates of a parallel-plat...
Text Solution
|
- A positively charged thin metal ring of radius R is fixed in the xy pl...
Text Solution
|
- A voltmeter having a resistance of 1800 Omega employed to measure the ...
Text Solution
|
- A microammeter has as resistance of 100 Omega and full scale range of ...
Text Solution
|
- A 100 W bulb B(1) and two 60 W bulbs B(2) and B(3), are connected to a...
Text Solution
|
- A short conducting rod P of length 3.0 cm is placed parallel to an nea...
Text Solution
|
- A rectangular loop carrying a current i is situated near a long strai...
Text Solution
|
- An electron and a proton enter a magnetic field at right angles to the...
Text Solution
|
- A gang capacitor is formed by interlocking a number of plates as shown...
Text Solution
|
- A galvanometer of resistance 25Omega is connected to a battery of 2 vo...
Text Solution
|
- A rectangular coil of 20 turns and area of cross-section 25 cm^(2) has...
Text Solution
|
- For perfectly coupled coils, the coupling coefficient should be equal ...
Text Solution
|
- A 200 muF capacitor in series with a 100 Omega resistance is connected...
Text Solution
|
- The overall efficiency of a transformer is 90%.The transformer is rate...
Text Solution
|
- In an experiment to find focal length of a concave mirror, a graph is ...
Text Solution
|
- In a reflecting astronomical telescope, if the objetcive (a spherical ...
Text Solution
|
- Which one of the following is a possible nuclear reaction ?
Text Solution
|
- A 5 W source emits monochromatic light of wavelength 5000 Å. When plac...
Text Solution
|
- Calculate in how many months , (3/4)^(th) of the substance will dacay,...
Text Solution
|