A
B
C
D
Text Solution
AI Generated Solution
The correct Answer is:


Topper's Solved these Questions
THERMODYNAMICS
NCERT FINGERTIPS ENGLISH|Exercise HOTs|8 VideosTHERMODYNAMICS
NCERT FINGERTIPS ENGLISH|Exercise Assertion & Reason|15 VideosTHERMAL PROPERTIES OF MATTER
NCERT FINGERTIPS ENGLISH|Exercise Assertion And Reason|10 VideosUNITS AND MEASUREMENTS
NCERT FINGERTIPS ENGLISH|Exercise Assertion And Reason|15 Videos
Similar Questions
Explore conceptually related problems
NCERT FINGERTIPS ENGLISH-THERMODYNAMICS-Assertion And Reason
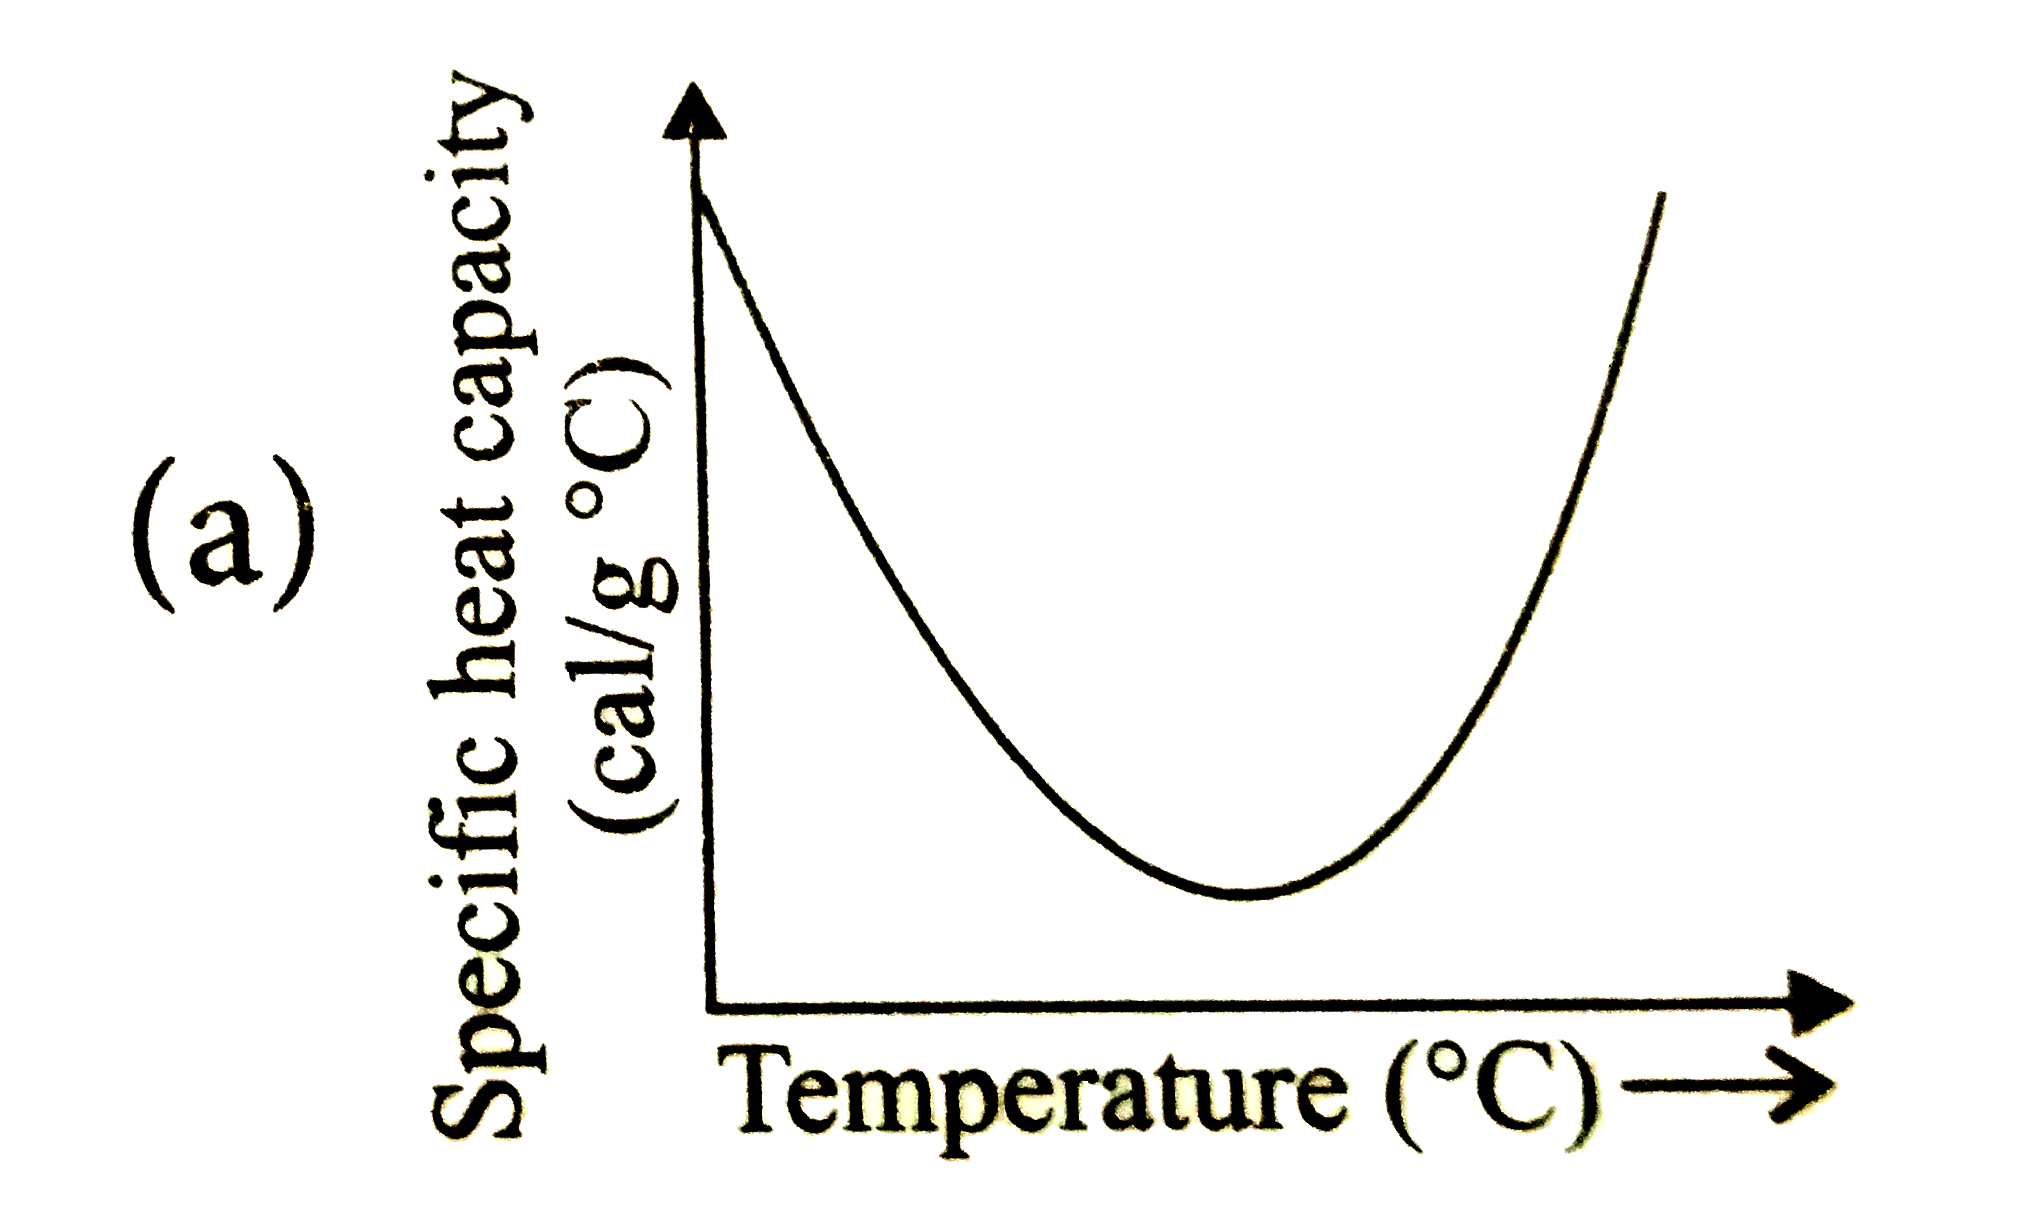
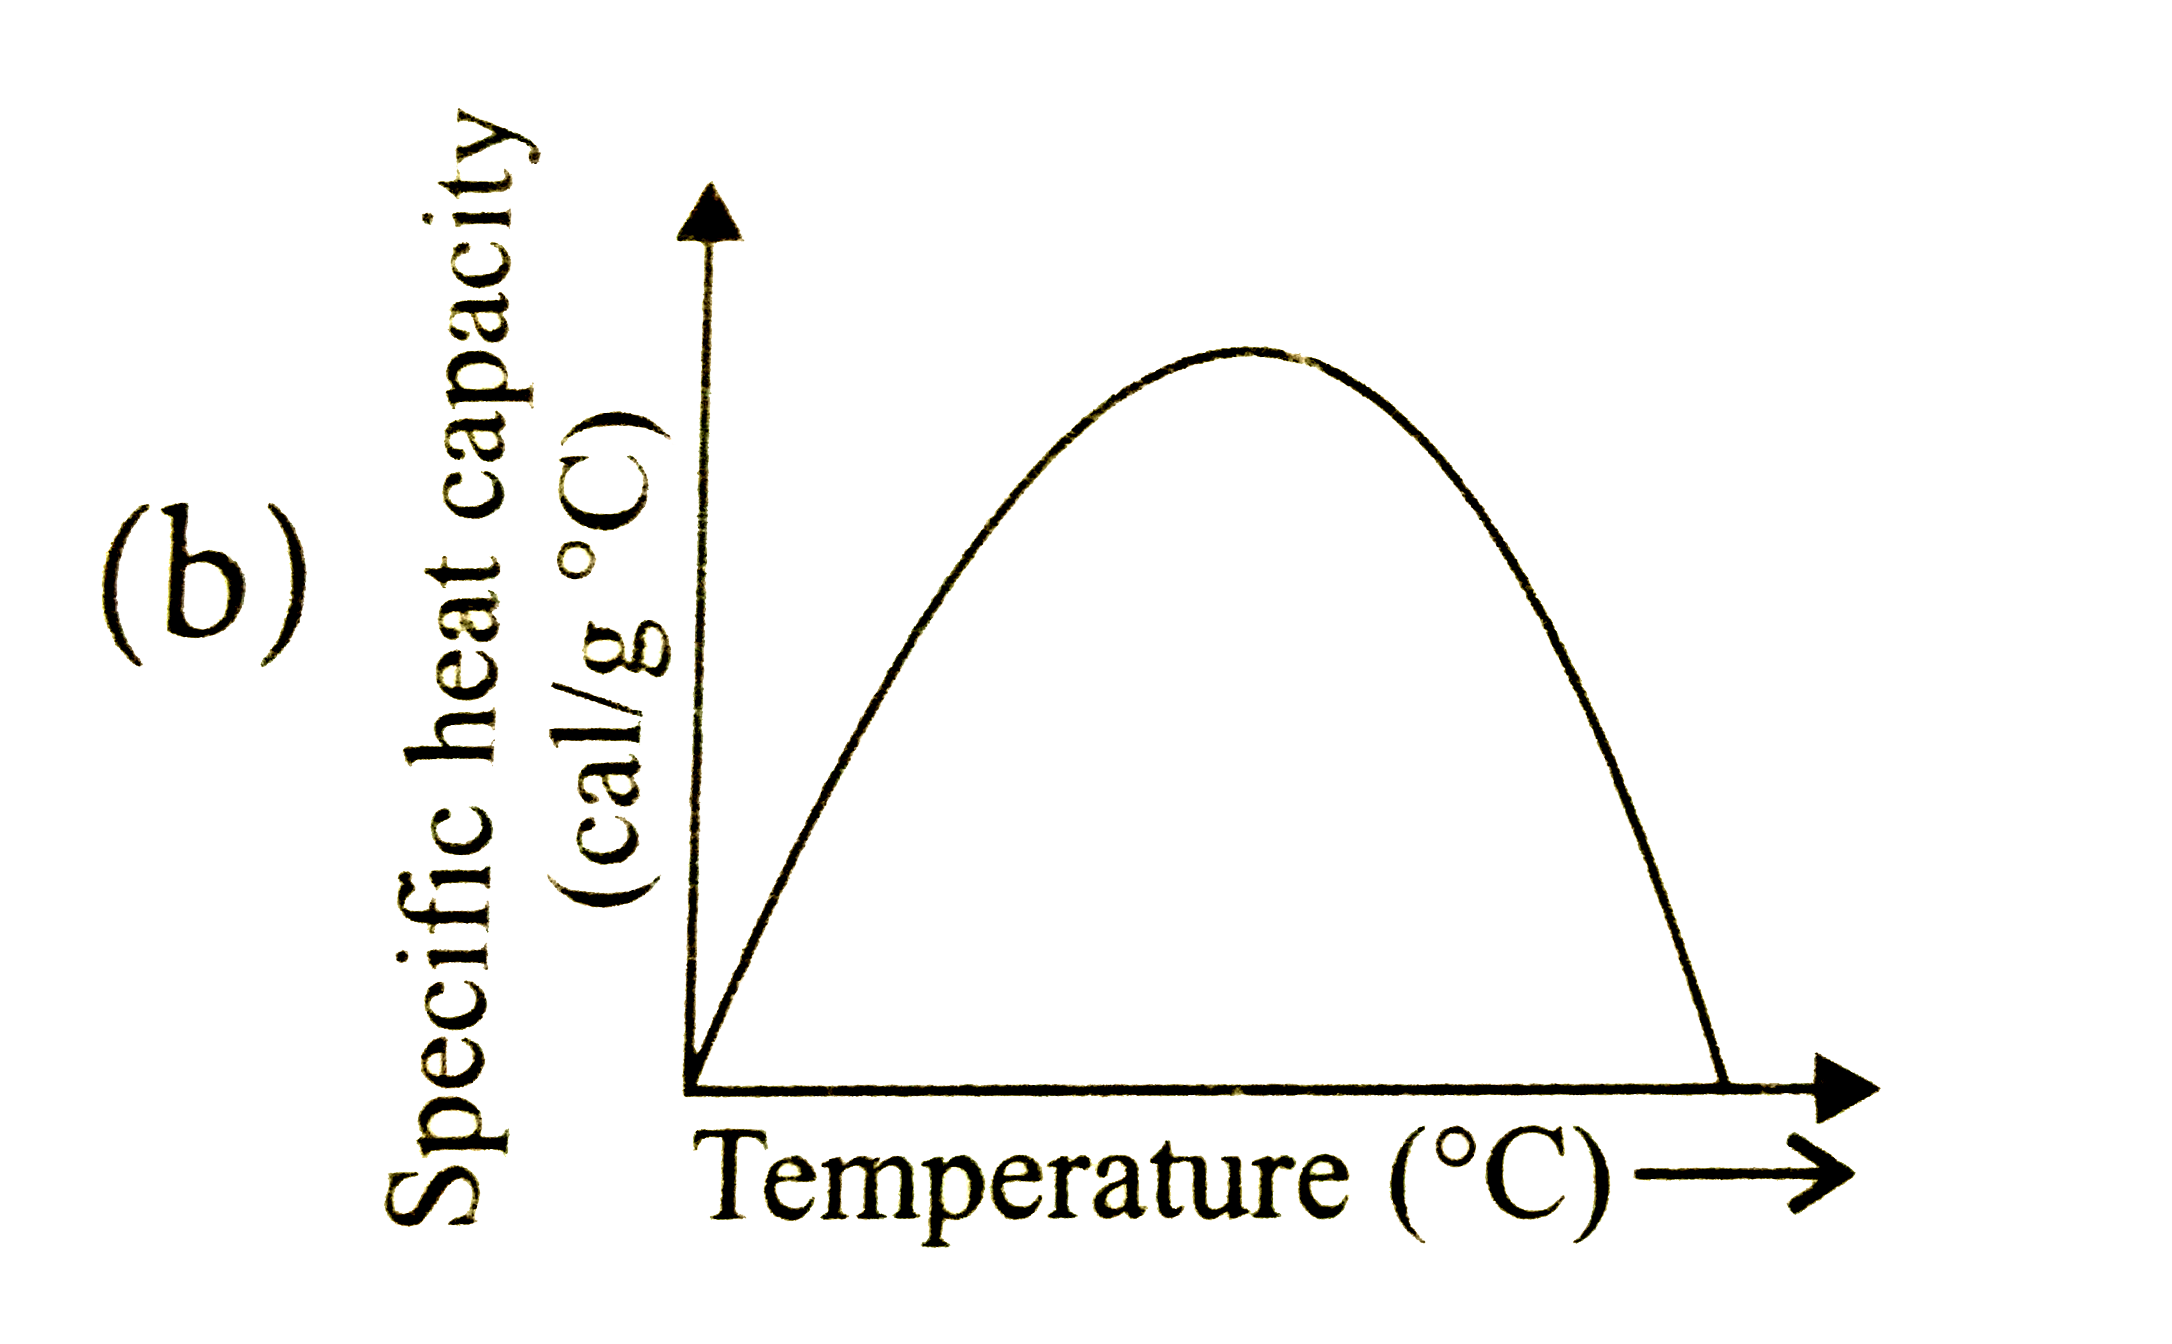
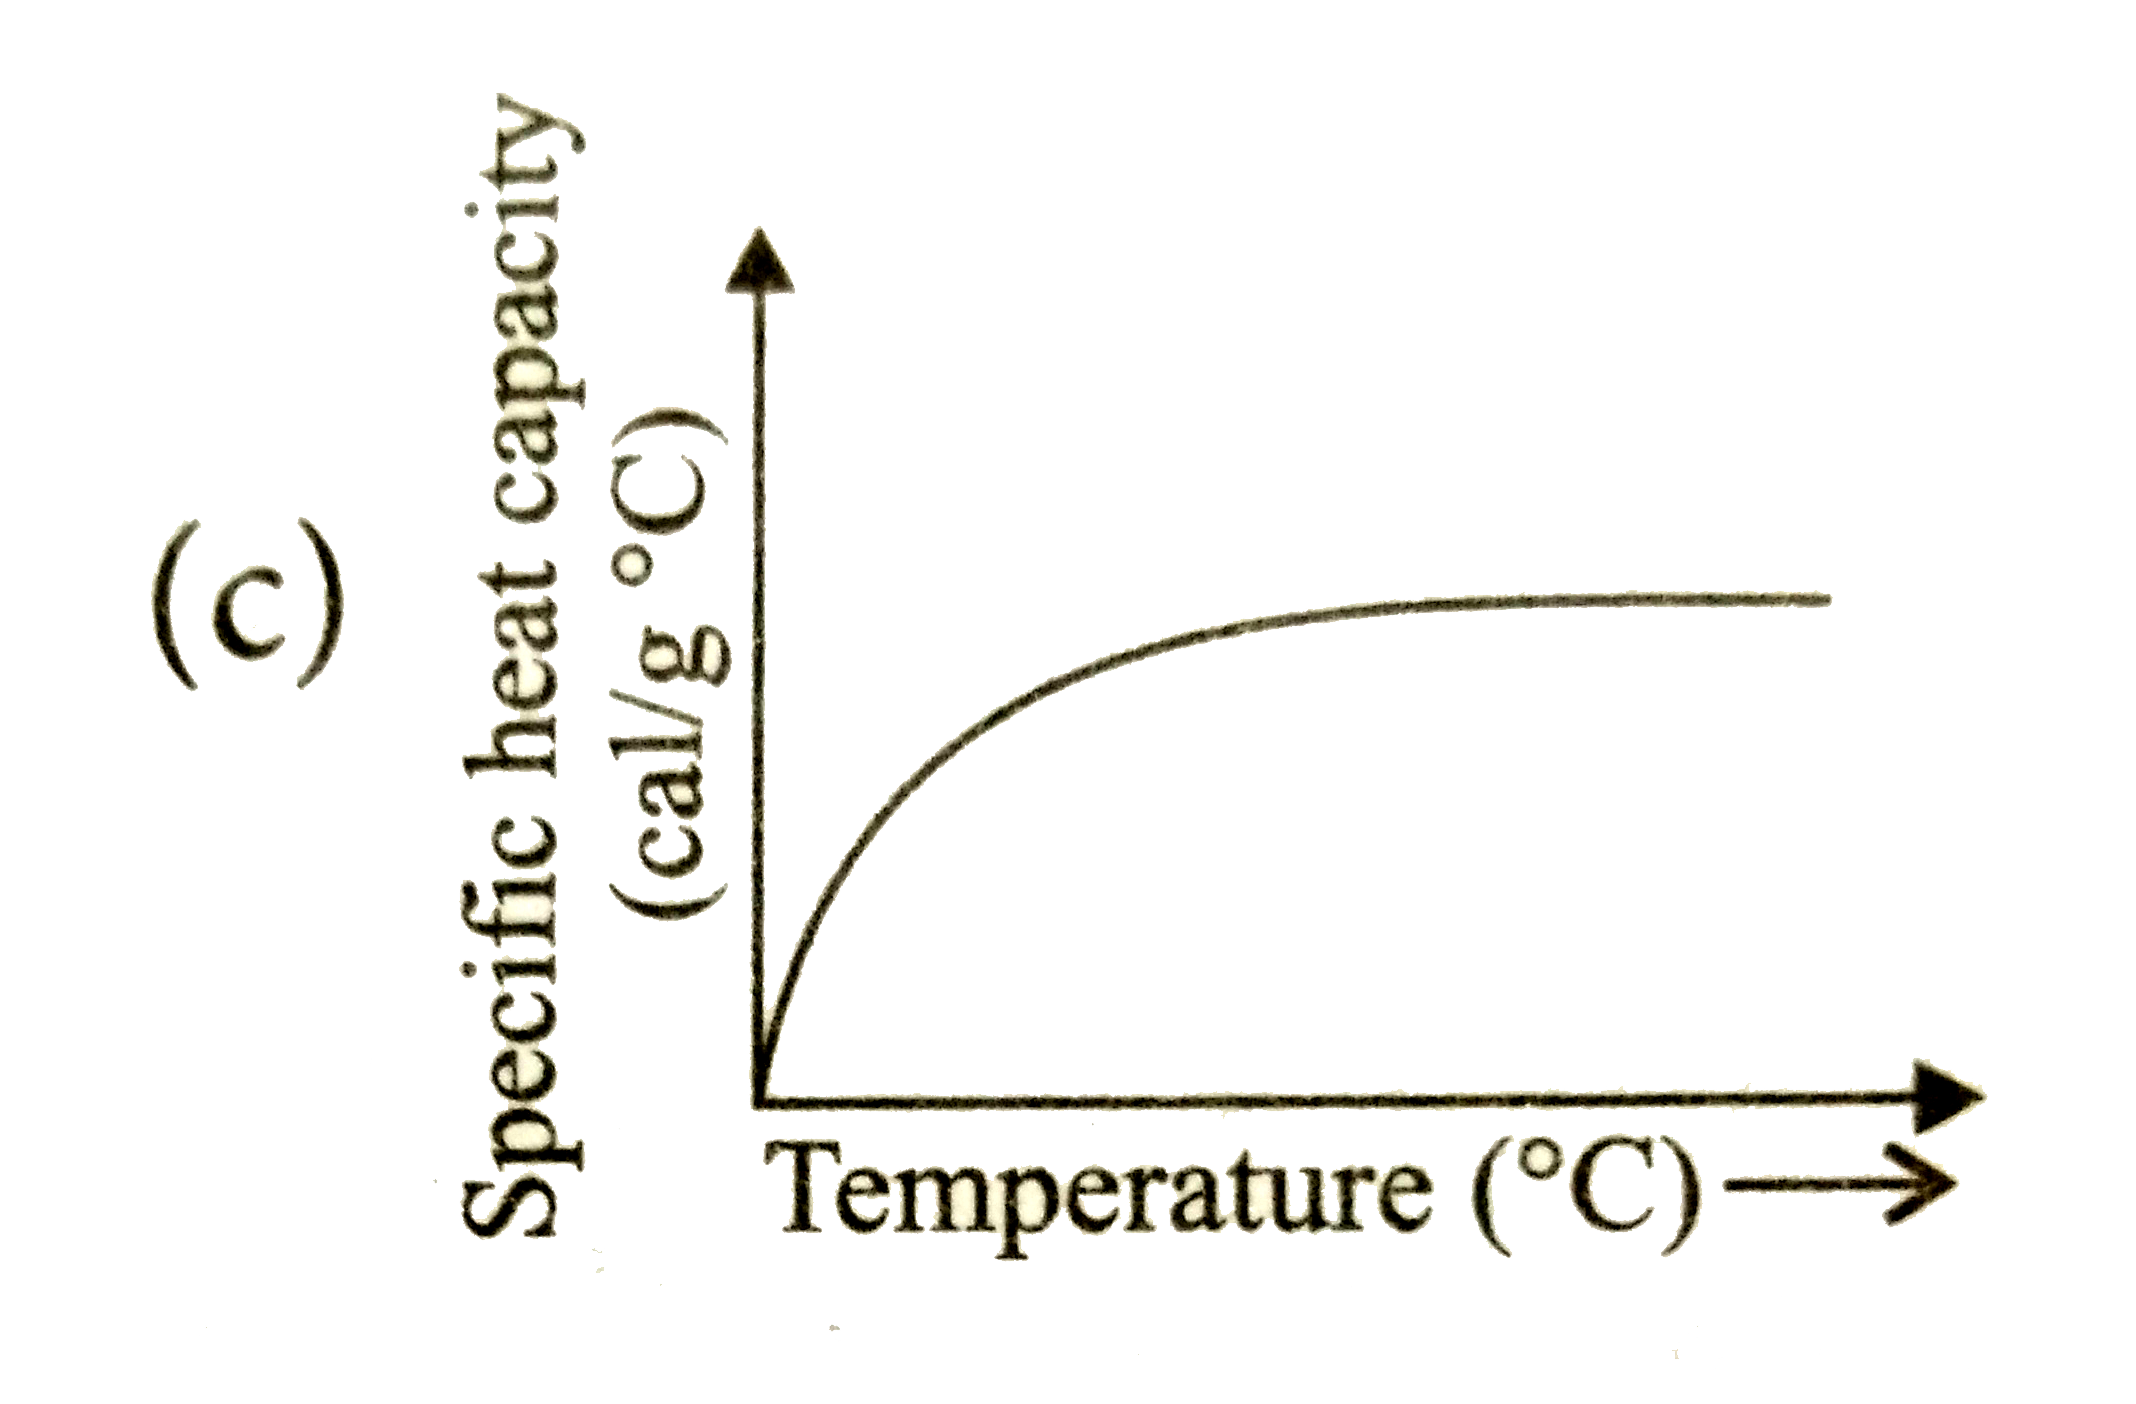
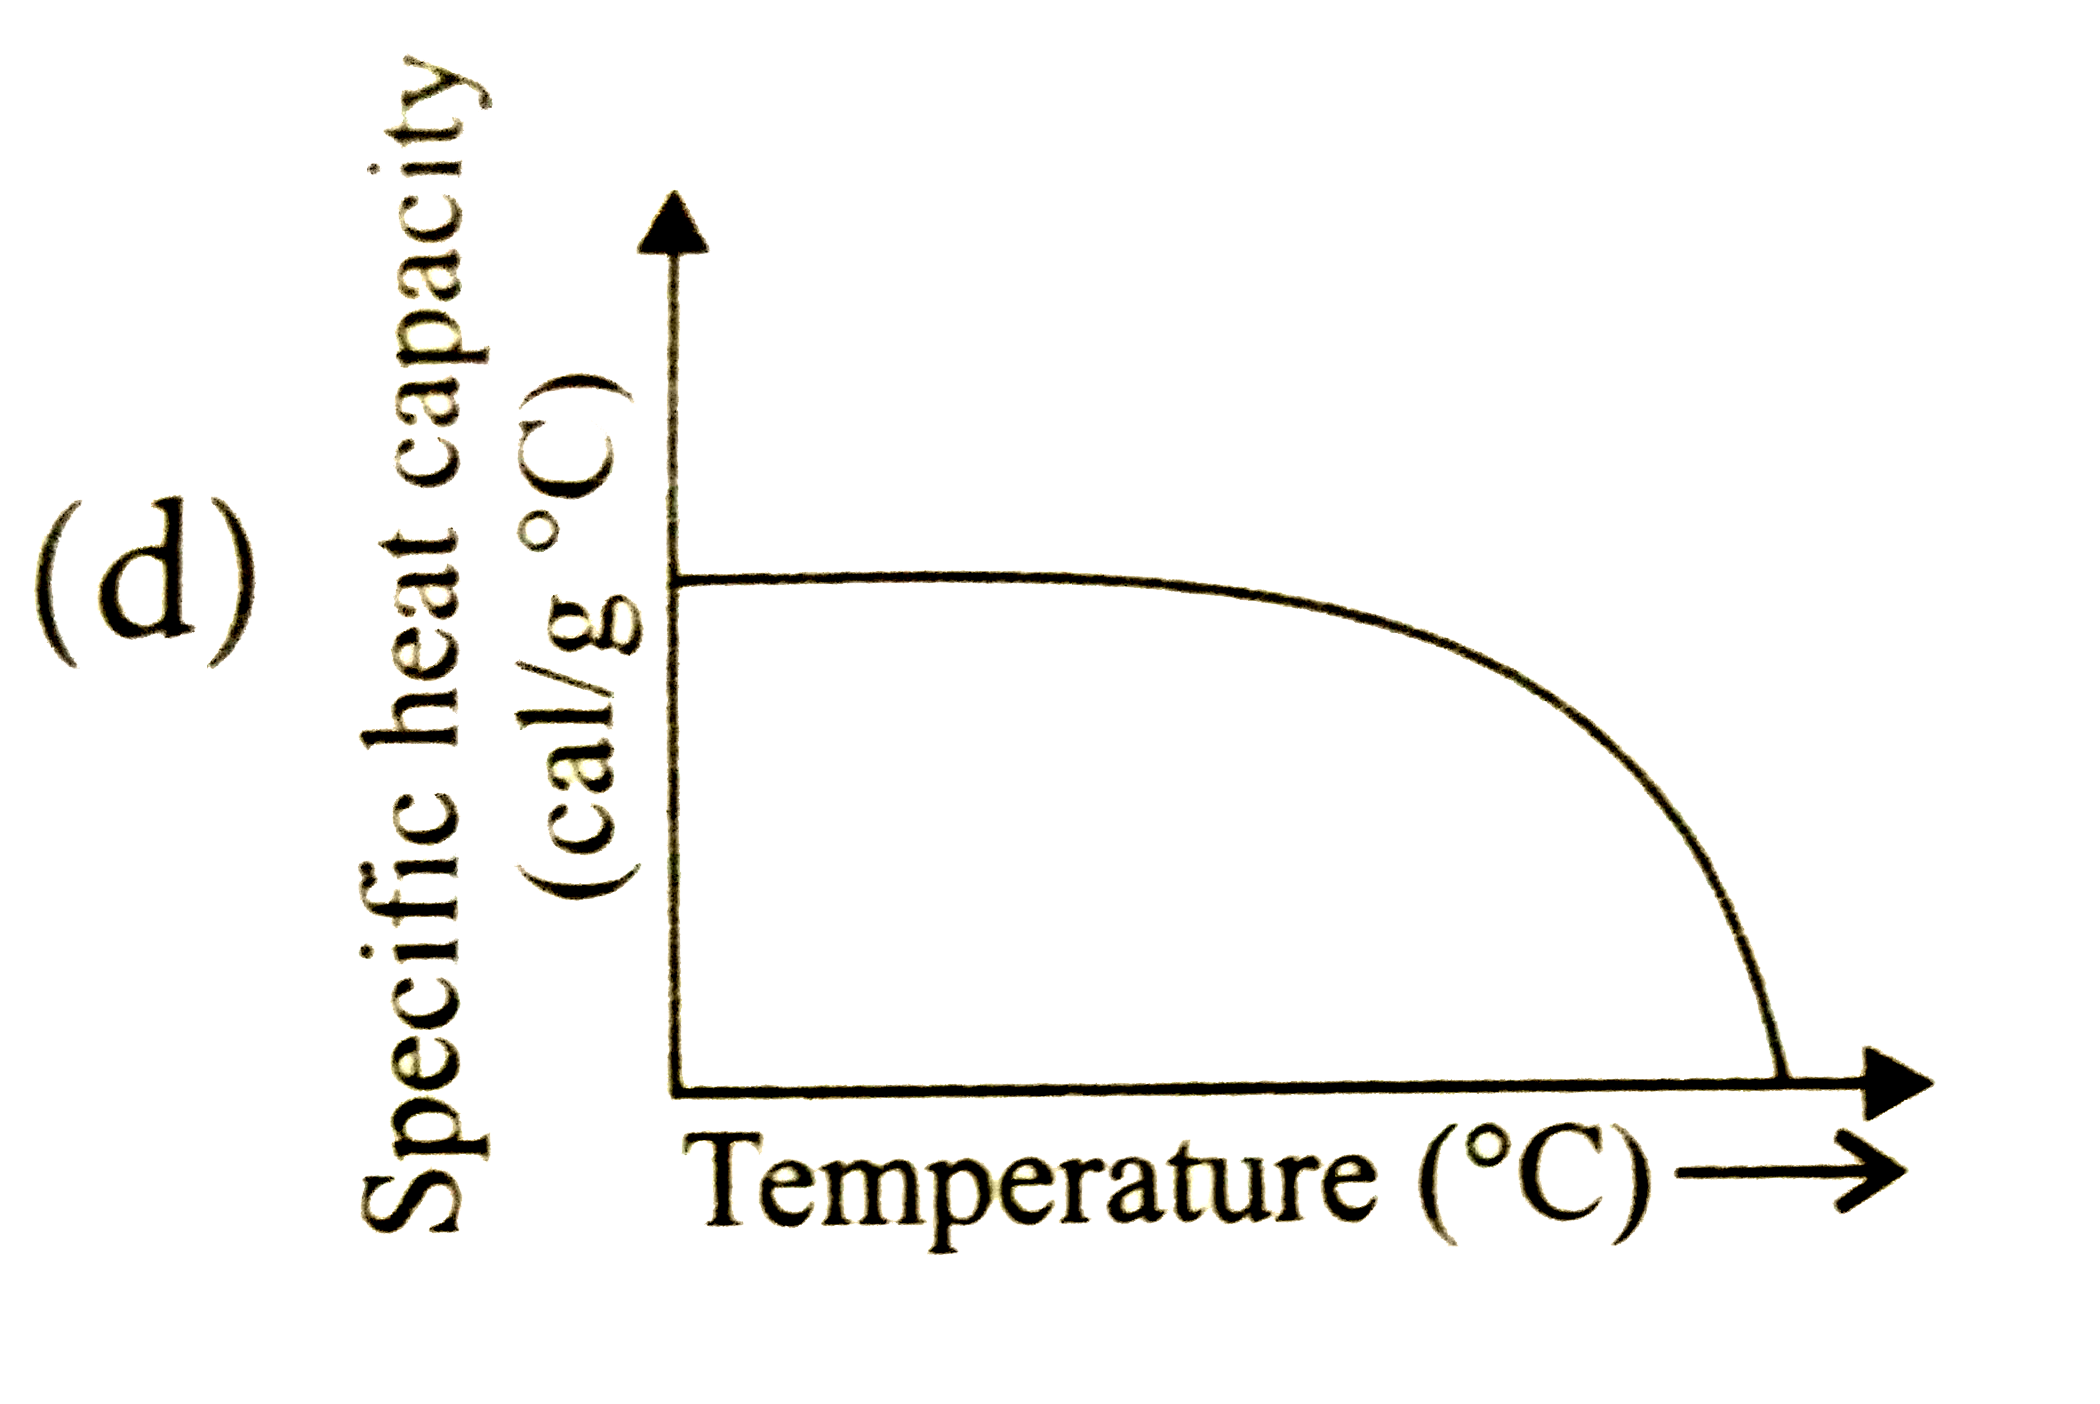
- Which one of the following graphs represents variation of specific hea...
Text Solution
|
- Assertion: The zeroth law said that , when two systems A and B, are in...
Text Solution
|
- Assertion : When a bullet is fired from a gun the bullet pierces a woo...
Text Solution
|
- Assertion : First law of thermodynamics does not forbid flow of heat f...
Text Solution
|
- Assertion:A constant volume gas thermometer, reads temperature in term...
Text Solution
|
- Assertion: The isothermal curves intersect each other at a certain poi...
Text Solution
|
- Assertion : In an isothemal expansion the gas absorbs heat and does wo...
Text Solution
|
- Assertion : In an adiabatic process, change in internal energy of a ga...
Text Solution
|
- Assetion : The temperature of a gas does not change when it undergoes...
Text Solution
|
- Assertion : In an isolated system the entropy increases. Reason : Th...
Text Solution
|
- Assertion: A heat engine is the reverse of a refrigerator. Reason : ...
Text Solution
|
- Assertion : The efficiency of a heat engine can never be unity. Reas...
Text Solution
|
- Assetion : A refrigerator transfers heat from a lower temperature to a...
Text Solution
|
- Assertion : A quasi static isothermal expansion of an ideal gas in a c...
Text Solution
|
- Assertion: Thermodynamics process in nature are irreversible. Reason...
Text Solution
|
- Assetion : No engine can have efficiencyt greater than that of the car...
Text Solution
|