Home
Class 12
CHEMISTRY
In the graph plotted between vapour pres...

In the graph plotted between vapour pressure (V.P.) and temperature (T),

A

PQ is the curve for solvent , XY is the curve of solution and `DeltaT` is depression in freezing point

B

PQ is the curve for solution. XY is the curve for solvent and `DeltaT` is elevation is boiling point

C

PQ is the curve for solvent, XY is the curve for solution and `DeltaT` is molal elevation in boiling point

D

PQ is the curve for solvent, XY is the curve for solution and `DeltaT` is elevation in boiling point

Text Solution

Verified by Experts

The correct Answer is:
D

PQ corresponds to increase in vapour pressure of solvent with temperature and XY corresponds to increase in vapour pressure of solution with temperature . `DeltaT` is the elevation in boiling point of a solution.
Promotional Banner

Topper's Solved these Questions

  • SOLUTIONS

    NCERT FINGERTIPS ENGLISH|Exercise Abnormal Molar Masses|16 Videos
  • SOLUTIONS

    NCERT FINGERTIPS ENGLISH|Exercise Higher Order Thinking Skills|10 Videos
  • SOLUTIONS

    NCERT FINGERTIPS ENGLISH|Exercise Ideal And Non-Ideal Solutions|13 Videos
  • PRACTICE PAPER -3

    NCERT FINGERTIPS ENGLISH|Exercise Practice Paper 3|50 Videos
  • SURFACE CHEMISTRY

    NCERT FINGERTIPS ENGLISH|Exercise Assertion And Reason|15 Videos

Similar Questions

Explore conceptually related problems

A graph is plotted between pressure and volume at different temperatures . On the basis of the graph what changes will you observe in the volume if (i) the pressure is increased at constant temperature . (ii) the temperature is decreased at constant pressure .

The following is a graph plotted between the vapour pressure of two volatile liquids against their respective mole fractions. Which of the following statements is/are correct?

The graph plotted against adsorption versus pressure P at constant temperature, the Freundich equation at A, B, C respectively are (if n gt 1)

A graph between vapour pressure and temperature of few liquids is given below . Study the graph and answer the following : Which of the following statements is true ?

The behaviour of ideal gas is goverened by various gas laws which are described by mathematical statements as given below: ( i ) PV=k (constant) at constant n and T ( ii ) V//T=k_(2) (constant) at constant n and P ( iii ) V//n=k_(3) (constant) at constant T and P ( iv ) PV=nRT ( v ) P//T=k_(4) (constant) at constant n and V Answer the following If we plot a graph between volume ( L ) and temperature ( -273.15^(@)C ) by studying their variation for 2.0 g of certain ideal gas at 1 bar pressure, the graph obtained is a straight line which is

The given graph shows the vapour pressure - temperature curves for some liquids Liquids A,B, C and D respectively are

Assertion: The plot of volume (V) versus pressure (P) at constant temperature is a hyperbola in the first quadrant. Reason: V prop 1//P at constant temperature.

The slope of the plot between pV and p at constant temperature is

If a graph is plotted between velocity (v) and displacement (y) of a particle executing SHM from mean position, then the nature of the graph is

NCERT FINGERTIPS ENGLISH-SOLUTIONS -Colligative Properties And Determination Of Molar Mass
  1. Vapour pressure of a pure liquid X is 2 atm at 300 K. It is lowered to...

    Text Solution

    |

  2. An aqueous solution of 2 per cent (wt.//wt) non-volatile solute exerts...

    Text Solution

    |

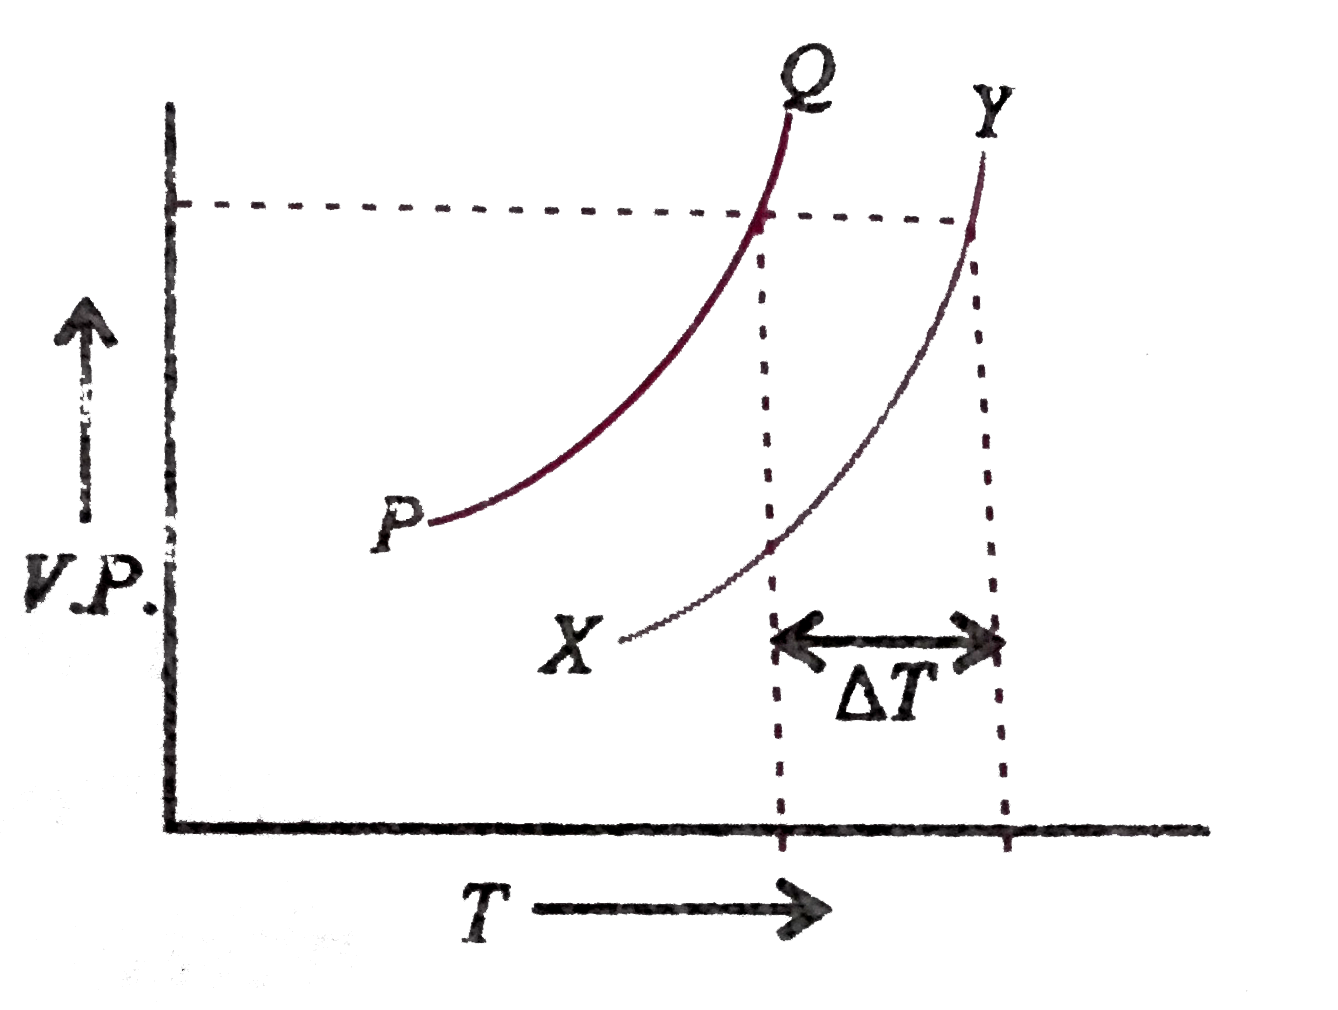
  3. In the graph plotted between vapour pressure (V.P.) and temperature (T...

    Text Solution

    |

  4. A solution containing 12.5 g of non-electrolyte substance in 185 g of ...

    Text Solution

    |

  5. If 1 g of solute (molar mass = 50 g mol^(-1)) is dissolved in 50 g of ...

    Text Solution

    |

  6. 2 g of sugar is added to one litre of water to give sugar solution. Wh...

    Text Solution

    |

  7. How does sprinking of salt help in clearing the snow covered roads in ...

    Text Solution

    |

  8. Equimolar solutions in the same solvent have-

    Text Solution

    |

  9. A 5% solution (w/W) of cane sugar (molar mass = 342 g mol^(-1) ) has f...

    Text Solution

    |

  10. What weight of glycerol should be added to 600 g of water in order to ...

    Text Solution

    |

  11. If semipermeable membrane is placed between the solvent and solution a...

    Text Solution

    |

  12. Study the following figure showing osmosis and mark the correct statem...

    Text Solution

    |

  13. Relative lowering of vapour pressure , osmotic pressure of a solution ...

    Text Solution

    |

  14. The osmotic pressure of a solution can be increased by

    Text Solution

    |

  15. People taking lot of salt experience puffiness or swelling of the body...

    Text Solution

    |

  16. The preservation of meat by salting and of fruits by adding sugar prot...

    Text Solution

    |

  17. Sea water is desalinated to get fresh water by which of the following ...

    Text Solution

    |

  18. A 5% solution of cane sugar (molecular weight=342) is isotonic with 1%...

    Text Solution

    |

  19. Which of the following statements is correct about diffusion and osmos...

    Text Solution

    |

  20. 10% solution of urea is isotonic with 6% solution of a non-volatile so...

    Text Solution

    |