A
B
C
D
Text Solution
Verified by Experts
The correct Answer is:


Topper's Solved these Questions
CHEMICAL KINETICS
NCERT FINGERTIPS ENGLISH|Exercise Higher Order Thinking Skills|9 VideosCHEMICAL KINETICS
NCERT FINGERTIPS ENGLISH|Exercise NCERT EXEMPLAR PROBLEMS|17 VideosBIOMOLECULES
NCERT FINGERTIPS ENGLISH|Exercise Assertion And Reason|15 VideosCHEMISTRY IN EVERYDAY LIFE
NCERT FINGERTIPS ENGLISH|Exercise NCERT Exemplar|15 Videos
Similar Questions
Explore conceptually related problems
NCERT FINGERTIPS ENGLISH-CHEMICAL KINETICS-Assertion And Reason
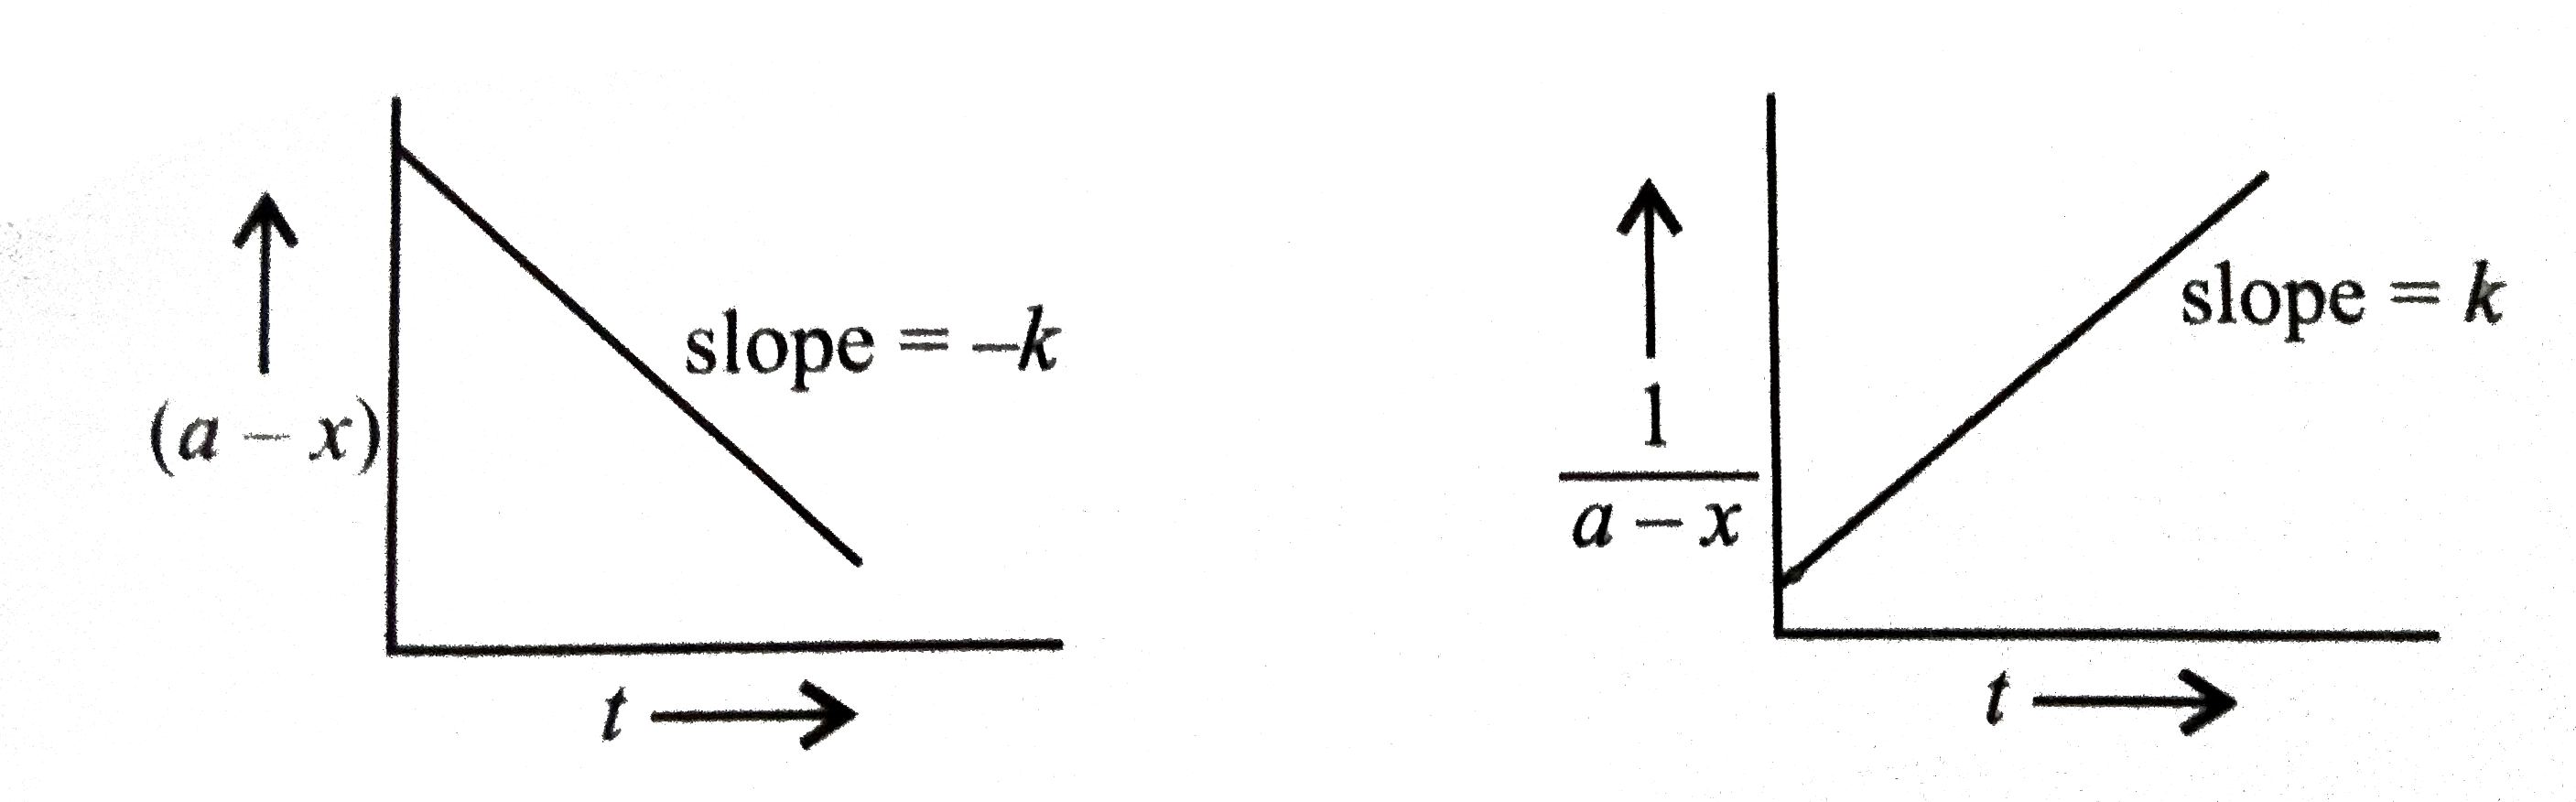
- Two plots are shown below between concentration and time t. Which of t...
Text Solution
|
- Assertion : Precipitation of silver chloride occurs instantaneously by...
Text Solution
|
- Assertion : The rate of reaction is the rate of change of concentratio...
Text Solution
|
- Assertion : For the reaction CHCI(3) + CI(2) to CCI(4) HCI Rate = ...
Text Solution
|
- Assertion : Order of a reaction with respect to any reactant can be ze...
Text Solution
|
- Assertion : Molecularity greater than three is not observed. Reason ...
Text Solution
|
- Assertion : Complex reaction takes place in different steps and the sl...
Text Solution
|
- Assertion : The decomposition of gaseous ammonia on a hot platinum sur...
Text Solution
|
- Assertion : For a first order reaction,t(1//2) is indepent of rate con...
Text Solution
|
- Assertion : The reaction underset("Cane sugar")(C(12)H(22)O(11)) + H...
Text Solution
|
- Assertion : The rate of a reaction sometimes does not depend on concen...
Text Solution
|
- Assertion : For a chemical reaction with rise in temperature by 10^(@)...
Text Solution
|
- Assertion : E(a) of the forward reaction is higher than that of backwa...
Text Solution
|
- Assertion : A catalyst increases the rate of reaction without itself u...
Text Solution
|
- Assertion : All molecules collisions lead to the formation of products...
Text Solution
|
- Assertion : Rate of reaction increases with increase in temperature. ...
Text Solution
|