A
B
C
D
Text Solution
Verified by Experts
The correct Answer is:


Topper's Solved these Questions
STATES OF MATTER
NCERT FINGERTIPS ENGLISH|Exercise HOTS (HIGHER ORDER THINKING SKILLS)|10 VideosSTATES OF MATTER
NCERT FINGERTIPS ENGLISH|Exercise NCERT (EXEMPLAR PROBLEMS)|11 VideosSOME BASIC CONCEPTS OF CHEMISTRY
NCERT FINGERTIPS ENGLISH|Exercise NCERT Exemplar|11 VideosSTRUCTURE OF ATOM
NCERT FINGERTIPS ENGLISH|Exercise Assertion And Reason|15 Videos
Similar Questions
Explore conceptually related problems
NCERT FINGERTIPS ENGLISH-STATES OF MATTER -Assertion And Reason
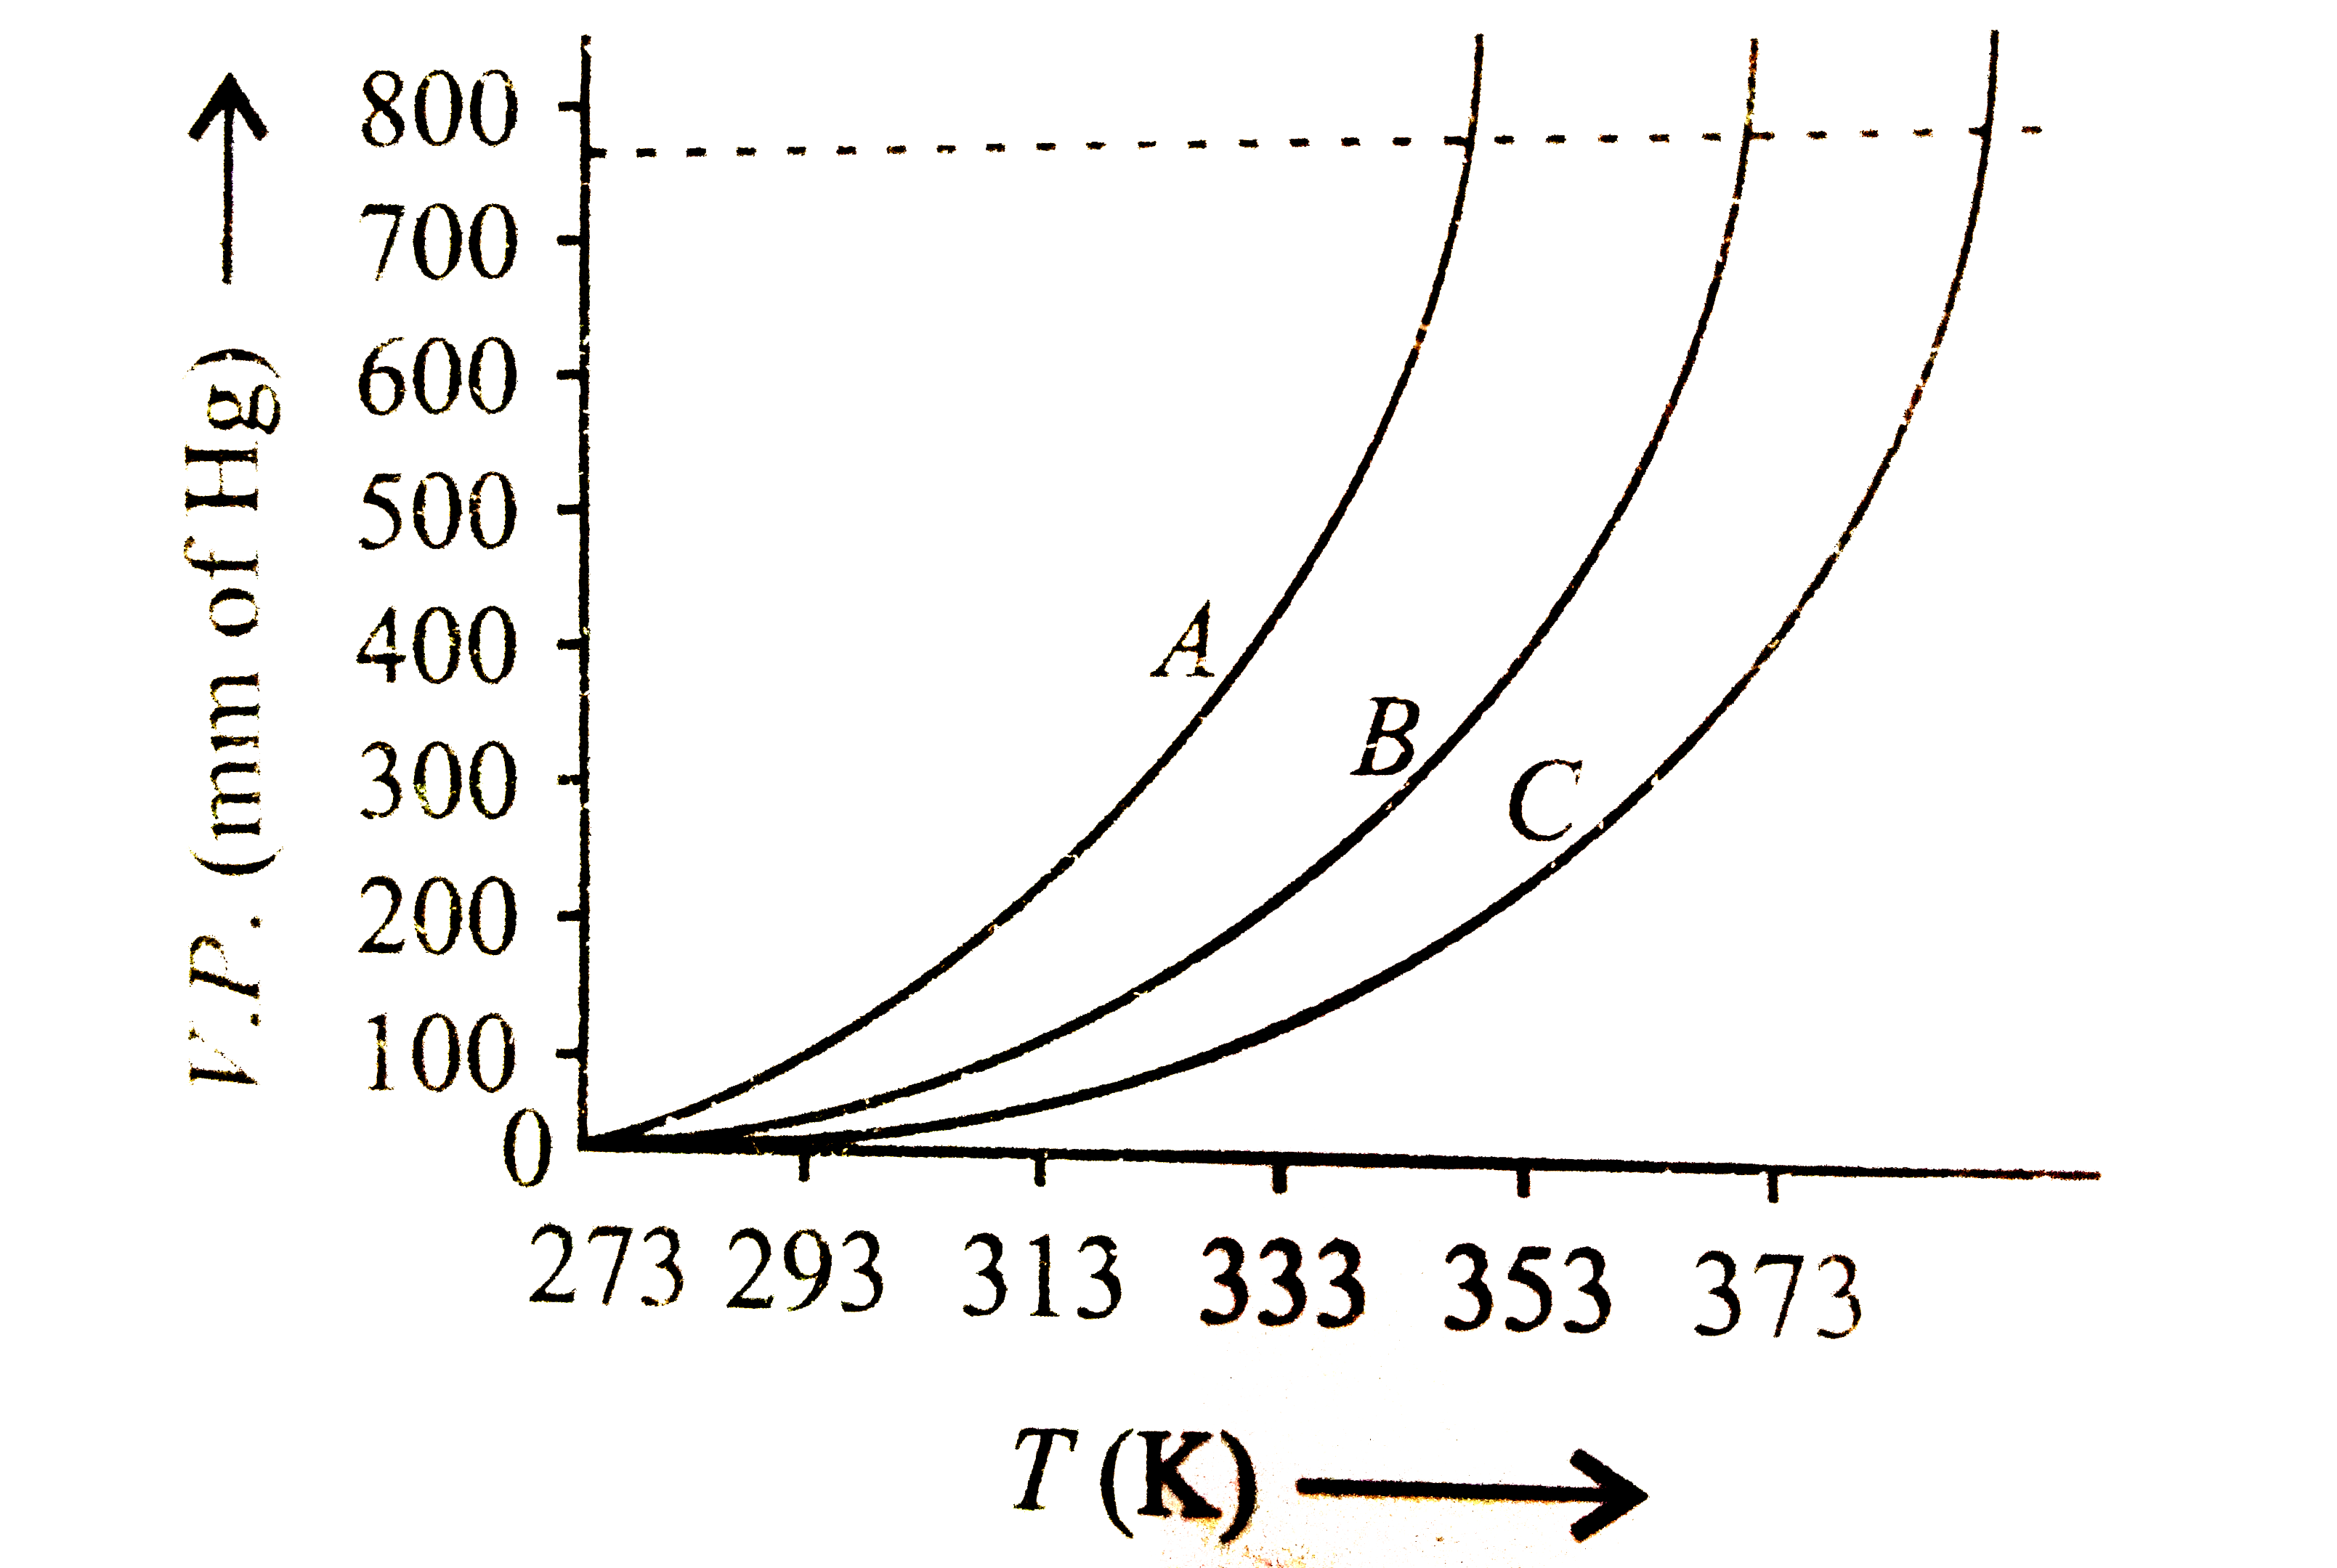
- A graph between vapour pressure and temperature of few liquids is give...
Text Solution
|
- Assertion : Dipole - dipole forces acting between the molecules posses...
Text Solution
|
- Assertion : Liquids and solids are hard to compress . Reason : Magn...
Text Solution
|
- Assertion : Gases become denser at high pressure . Reason : At hig...
Text Solution
|
- Assertion : The lowest hypothetical or imaginary temperature at which ...
Text Solution
|
- Assertion : At constant temperature PV vs P plot for real gases is not...
Text Solution
|
- Assertion : Molar volume of an ideal gas at 273 . 15 K and 1 bar is 22...
Text Solution
|
- Assertion : In Maxwell - Boltzmann distribution of speeds , the curve ...
Text Solution
|
- Assertion : The gases show ideal behaviour when the volume occupied is...
Text Solution
|
- Assertion : Compressibility factor (Z) is the ratio of actual molar vo...
Text Solution
|
- Assertion :- On cooling ,ammonia lirquifies first whereas CO(2) requi...
Text Solution
|
- Assertion : All the gases should be cooled below their critical temper...
Text Solution
|
- Assertion : At high altitudes , liquids boil at lower temperatures in ...
Text Solution
|
- Assertion : The normal boiling point of water is 100 C^(@) and standar...
Text Solution
|
- Assertion : Viscosity of liquids decreases as the temperature rises . ...
Text Solution
|
- Assertion : Windowpanes of old building become thicker at the bottom t...
Text Solution
|