A
B
C
D
Text Solution
Verified by Experts
The correct Answer is:


Topper's Solved these Questions
STATES OF MATTER
NCERT FINGERTIPS ENGLISH|Exercise Assertion And Reason|15 VideosSTATES OF MATTER
NCERT FINGERTIPS ENGLISH|Exercise Higher Order Thinking Skills|8 VideosSOME BASIC CONCEPTS OF CHEMISTRY
NCERT FINGERTIPS ENGLISH|Exercise NCERT Exemplar|11 VideosSTRUCTURE OF ATOM
NCERT FINGERTIPS ENGLISH|Exercise Assertion And Reason|15 Videos
Similar Questions
Explore conceptually related problems
NCERT FINGERTIPS ENGLISH-STATES OF MATTER -NCERT Exemplar
- A person living in shimla observd that cooking without using pressure ...
Text Solution
|
- Which of the following property of water can be used to explain the sp...
Text Solution
|
- the interaction energy of London force is inversely proportional to si...
Text Solution
|
- Dipole-dipole forces act between the molecules possessing permanent di...
Text Solution
|
- the pressure of a 1 : 4 mixture of dihydrogen and dioxygen enclosed in...
Text Solution
|
- As the temperature increases, average kinetic energy of molecules incr...
Text Solution
|
- What is SI unit of viscosity coefficient (eta) ?
Text Solution
|
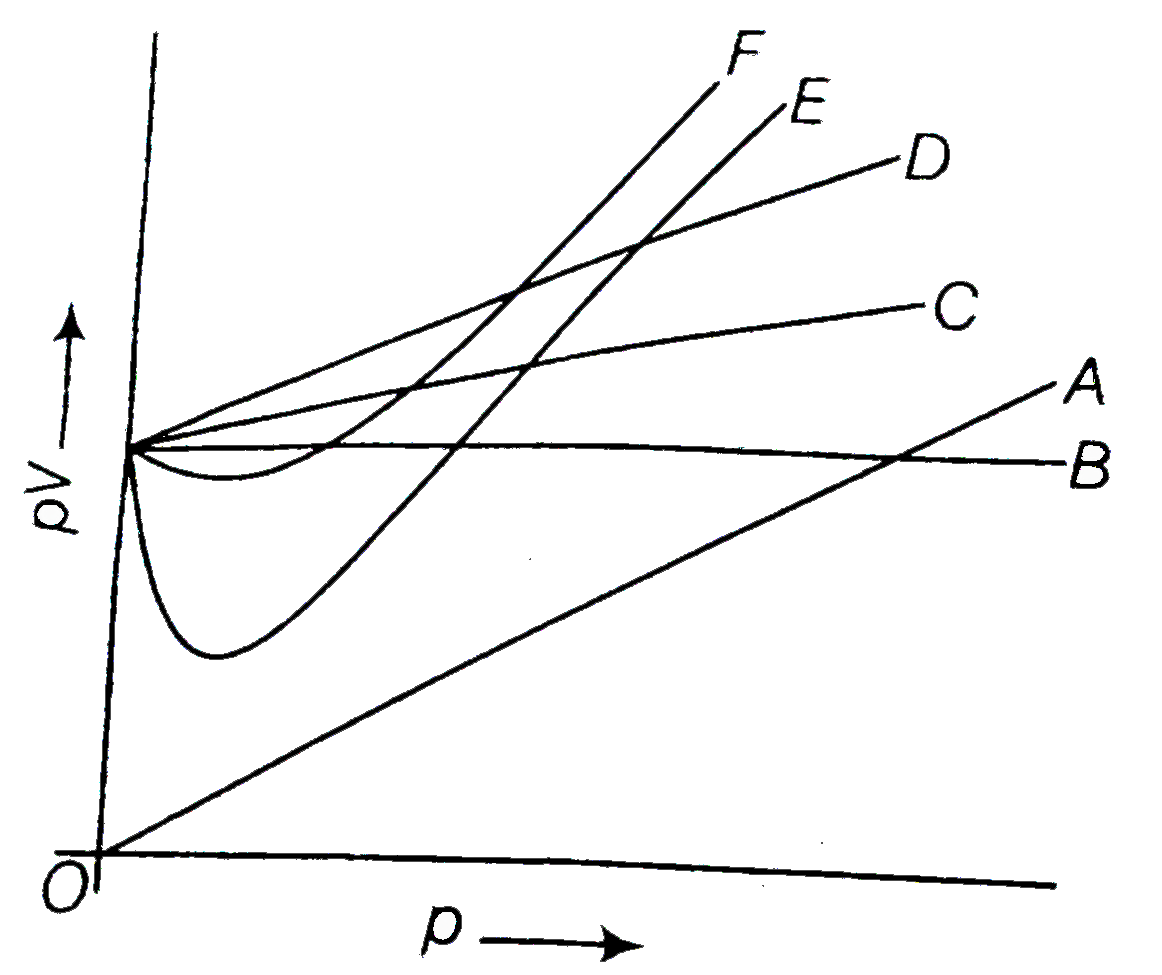
- Which curve in figure represents the curve of ideal gas ?
Text Solution
|
- Increase in kinetic energy can overcome intermolecular forces of attra...
Text Solution
|
- How does the surface tension of a liquid vary with increase in tempera...
Text Solution
|