A
B
C
D
Text Solution
Verified by Experts
The correct Answer is:


Topper's Solved these Questions
THERMAL PROPERTIES OF MATTER
AAKASH SERIES|Exercise EXPANSION OF GASES (PRACTICE SHEET) LEVEL-II (More than One correct answer Type Questions)|5 VideosTHERMAL PROPERTIES OF MATTER
AAKASH SERIES|Exercise EXPANSION OF GASES (PRACTICE SHEET) LEVEL-II (Linked Comprehension Type Questions)|6 VideosTHERMAL PROPERTIES OF MATTER
AAKASH SERIES|Exercise EXPANSION OF GASES (PRACTICE SHEET) LEVEL-I (Straight Objective Type Questions) Kinetic theory of gases|15 VideosSYSTEM OF PARTICLES AND ROTATIONAL MOTION
AAKASH SERIES|Exercise PRACTICE EXERCISE|99 VideosTHERMODYNAMICS
AAKASH SERIES|Exercise EXERCISE - 3|33 Videos
Similar Questions
Explore conceptually related problems
AAKASH SERIES-THERMAL PROPERTIES OF MATTER-EXPANSION OF GASES (PRACTICE SHEET) LEVEL-II (Straight Objective Type Questions)
- An ideal gas is trapped between mercury thread of 12cm and the closed ...
Text Solution
|
- Two bulbs of 100 c.c and 200 c.c capacity, contain the same gas at sam...
Text Solution
|
- A vertical hollow cylinder of height 1.52 m is fitted with a movable p...
Text Solution
|
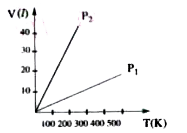
- Volume versus temperature graphs for a given mass of an ideal gas are ...
Text Solution
|
- 1 mole of an ideal gas is contained in a cubical volume V, ABCDEFGH at...
Text Solution
|
- A cylinder containing an ideal gas is in vertical position and has a p...
Text Solution
|
- Diatomic molecules like hydrogen have energies due to both translation...
Text Solution
|
- A gas of temperature T0 is enclosed in a container whose walls are (in...
Text Solution
|
- Assume a sample of gas in a vessel. The speeds of molecules are betwee...
Text Solution
|
- The C(P) // C(V) ratio for a gas mixture consisting of 4g of helium an...
Text Solution
|