A
B
C
D
Text Solution
Verified by Experts
The correct Answer is:


Topper's Solved these Questions
THERMAL PROPERTIES OF MATTER
AAKASH SERIES|Exercise ADDITIONAL PRACTICE EXERCISE (LEVEL - II) PRACTICE SHEET (ADVANCED) More than One correct answer Type Questions|7 VideosTHERMAL PROPERTIES OF MATTER
AAKASH SERIES|Exercise ADDITIONAL PRACTICE EXERCISE (LEVEL - II) PRACTICE SHEET (ADVANCED) Linked Comprehension Type Questions|11 VideosTHERMAL PROPERTIES OF MATTER
AAKASH SERIES|Exercise ADDITIONAL PRACTICE EXERCISE (LEVEL - II) PRACTICE SHEET (ADVANCED) Straight Objective Type Questions (Expansion of Liquids :)|6 VideosSYSTEM OF PARTICLES AND ROTATIONAL MOTION
AAKASH SERIES|Exercise PRACTICE EXERCISE|99 VideosTHERMODYNAMICS
AAKASH SERIES|Exercise EXERCISE - 3|33 Videos
Similar Questions
Explore conceptually related problems
AAKASH SERIES-THERMAL PROPERTIES OF MATTER-ADDITIONAL PRACTICE EXERCISE (LEVEL - II) PRACTICE SHEET (ADVANCED) Straight Objective Type Questions (Expansion of Gases & KTG :)
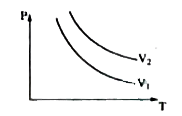
- Figure shows the pressure versus temperature curves for a given mass o...
Text Solution
|
- One mole of an ideal gas is taken from state A to state B as shown in ...
Text Solution
|
- Figure shows the graph of pressure (P) versus temperature (T) (which i...
Text Solution
|
- Consider a hypothetical velocity distribution of gas molecules shown i...
Text Solution
|
- Fig shows the Maxwell's velocity distribution curves 'p' and 'q' for t...
Text Solution
|
- Figure shows the plot of the logarithm of the number 'N' of molecules ...
Text Solution
|
- Figure shows a cylinder containing helium gas at atmospheric pressure ...
Text Solution
|
- n' moles of an ideal gas, undergo a process V(V-a)^(2) = bT - cV. What...
Text Solution
|
- A vertical cylinder contains an ideal gas enclosed, at a pressure of 2...
Text Solution
|