Home
Class 11
MATHS
Two plant A and B of a factory show foll...

Two plant A and B of a factory show following results about the number of workers and the wages paid to them.

In which plant, A or B is there greater variability in individual wages ?

Text Solution

Verified by Experts

The correct Answer is:
The plant B has greater variability in the individual wages.
Promotional Banner

Topper's Solved these Questions

  • STATISTICS

    KUMAR PRAKASHAN|Exercise NCERT EXEMPLAR PROBLEMS (SHORT ANSWER TYPE QUESTIONS)|23 Videos
  • STATISTICS

    KUMAR PRAKASHAN|Exercise NCERT EXEMPLAR PROBLEMS (OBJECTIVE TYPE QUESTIONS)|16 Videos
  • STATISTICS

    KUMAR PRAKASHAN|Exercise LATEST EXAM MCQS|1 Videos
  • SETS

    KUMAR PRAKASHAN|Exercise QUESTION OF MODULE|28 Videos
  • STRAIGHT LINES

    KUMAR PRAKASHAN|Exercise Question of Module (Knowledge Test :)|18 Videos

Similar Questions

Explore conceptually related problems

An analysis of monthly wagis paid to worker in two parts. A anb B of factory are given below: Which part A or B, show greater variability in indiviual wages?

An analysis of monthly wages paid to workers in two firms A and B , belonging to the same industry , gives the following results: (i) Which firm A or B pays larger amount as monthly wages? (ii) Which firm , A or B, shows greater variability in individual wages?

The following figure shows the magnetic field between two magnets . Which magnetic poles are there at points A and B respectively ?

An experiment involves rolling a pair of dice and recording the numbers that come up. Describe the following events : A : the sum is greater then 8. B : 2 occurs on either die C : the sum is at least 7 and a multiple of 3. Which pairs of these events are mutually exclusive ?

PQ is a current - carrying long straight conductor in the plance of the paper as shown in the following figure. A and B are two points at distances r_(1) and r_(2) from it . If r_(2) gt r_(2) at which point will the strength of the magnetic field be greater ? Justify your answer .

Which of the following is not an example of water pollinated plant? (A) Zostera (B) Viola (C) Vallisneria (D) Hydrilla

Each phase of a material can exits only in certain regions of pressure and temperature . P-T phase diagrams, in which pressure is plotted versus temperature, show the regions corresponding to various phases and phase transformations . P-V diagrams, on the other hand , can be used to study pressure volume relationship at a constant temperature. If the liquid and gaseous phases of a pure substances are heated together in a closed container, both the temperature and the vapor pressure will increase until a point is reached at which the two phases can no longer be distinguished from one another. The temperature and pressure at which this occurs are called the critical temperature and pressure. Exceeding either of these parameters, by itself ,will cause the "gas"//"liguid" phase transition to disappear. if the other variable is then changed as well, while the first variable is maintained above its critical point , a gradual transition will occur between the gaseous and liquid phases, with no clear boundary.(The liquid and solid phases, on the other hand , maintain a distinct boundary at all pressure above the triple point). Shown in figure is a combined P-T phase diagram for material A and B . Which is true about the substance in figure?

KUMAR PRAKASHAN-STATISTICS-TEXTBOOK ILLUSTRATIONS FOR PRACTICE WORK
  1. Find the mean and variance for each of the data : 6,7,10,12,13,4,8...

    Text Solution

    |

  2. Find the mean deviation about the mean for the following data: 12,3,1...

    Text Solution

    |

  3. Find the mean deviation about the median for the following data: 3,9,...

    Text Solution

    |

  4. Find the mean deviation about the mean for the given data :

    Text Solution

    |

  5. Find the mean deviation about the median for the given data:

    Text Solution

    |

  6. Find the mean deviation about the median for the following data:

    Text Solution

    |

  7. Calculate the mean deviation about median for the following data :

    Text Solution

    |

  8. Find the variance of the following data: 6,8,10,12,14,16,18,20,22,24

    Text Solution

    |

  9. Find the variance and standard deviation for the following data :

    Text Solution

    |

  10. Calculate the mean , variance and standard deviation for the following...

    Text Solution

    |

  11. Find the standard deviation for the following data:

    Text Solution

    |

  12. Calculate the mean , variance and standard deviation for the following...

    Text Solution

    |

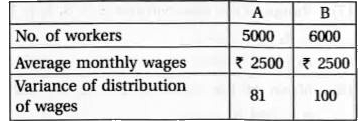
  13. Two plant A and B of a factory show following results about the number...

    Text Solution

    |

  14. Coefficient of variation of two distributions are 60 and 70 their stan...

    Text Solution

    |

  15. The following values are calculated in respect of heights and weights ...

    Text Solution

    |

  16. The variance of 20 observations is 5. if each observation is multiplie...

    Text Solution

    |

  17. The mean of 5 observations is 4.4 and their variance is 8.24 . If thre...

    Text Solution

    |

  18. If each of the observation x(1), x(2), ...,x(n) is increased by 'a', w...

    Text Solution

    |

  19. The mean and standard deviation of 100 observation were calculated as ...

    Text Solution

    |