Home
Class 11
MATHS
Following are the marks obtained , out o...

Following are the marks obtained , out of 100 by two students ravi and hashina in 10 tests.

Who is more intelligent and who is more consistent?

Promotional Banner

Topper's Solved these Questions

  • STATISTICS

    KUMAR PRAKASHAN|Exercise NCERT EXEMPLAR PROBLEMS (OBJECTIVE TYPE QUESTIONS)|16 Videos
  • STATISTICS

    KUMAR PRAKASHAN|Exercise NCERT EXEMPLAR PROBLEMS (FILLERS)|6 Videos
  • STATISTICS

    KUMAR PRAKASHAN|Exercise TEXTBOOK ILLUSTRATIONS FOR PRACTICE WORK|19 Videos
  • SETS

    KUMAR PRAKASHAN|Exercise QUESTION OF MODULE|28 Videos
  • STRAIGHT LINES

    KUMAR PRAKASHAN|Exercise Question of Module (Knowledge Test :)|18 Videos

Similar Questions

Explore conceptually related problems

Following are the marks obtained by 9 students in a mathematics test : 50, 69 , 20, 33, 53, 39, 40, 65 and 59 The mean deviation from the median is …………

Consider the marks obtained (out of 100 marks) by 30 students of Class IX of a school : Represent this data in a frequency distribution table

The runs made by two players A and B in three test match series are as following. Which player is more consistent?

There are 60 students in a class . The following is the frequency distribution of the marks obtained by the student in a test. Where x is a positive integer. Determine the mean and standard deviation of the marks.

Consider the marks obtained by 10 students in a mathematics test as given below: 55 36 95 73 60 42 25 78 75 62 Find the range of the data.

Let U be the set of all people and M = {Males}, S = {College students}, T = {Teenagers}, W = {People having height more than five feet}. Express each of the following in the notation of set theory. (i) College student having heights more than five feet (ii) People who are not teenagers and have their height less five feet (iii) All people who are neither males nor teenagers nor college students.

The following table gives the distribution of students of two sections according to the marks obtained by them: Represent the marks of the students of both the sections on the same graph by two frequency polygons. From the two polygons compare the performance of the two sections.

A class has 175 students. The following table shows the number of students studying one or more of the following subjects in this case. How many students are enrolled in Mathematics alone, Physics alone and Chemistry alone? Are there students who have not offered any one of these subjects?

A teacher wanted to analyse the performance of two sections of students in a mathematics test of 100 marks. Looking at their performances, she found that a few students got under 20 marks and a few got 70 marks or above. So she decided to group them into intervals of varying sizes as follows: 0 - 20, 20-30, .... 60-70, 70 - 100 Then she formed the following table :

KUMAR PRAKASHAN-STATISTICS-NCERT EXEMPLAR PROBLEMS (SHORT ANSWER TYPE QUESTIONS)
  1. Find the algebraic sum of the deviations of all the observations from ...

    Text Solution

    |

  2. Find the standard deviation of the first n natural numbers.

    Text Solution

    |

  3. the mean and standard deviation of some data for the time taken to com...

    Text Solution

    |

  4. Mean and standard deviation of the random variable X are (7)/(3) and (...

    Text Solution

    |

  5. Two sets each of 20 observations , have the same standard deviation 5....

    Text Solution

    |

  6. The frequency distribution : Where A is a positive integer , ha...

    Text Solution

    |

  7. For the frequency distribution: Find the standard distribution ...

    Text Solution

    |

  8. There are 60 students in a class . The following is the frequency dist...

    Text Solution

    |

  9. The mean life of a sample of 60 bulbs was 650 hours and the standard d...

    Text Solution

    |

  10. Mean and standard deviation of 100 items are 50 and 4, respectively . ...

    Text Solution

    |

  11. If for a distribution sum(x-5) = 3, sum(x - 5)^2 = 43 and the total nu...

    Text Solution

    |

  12. Find the mean variance of the frequency distribution given below :

    Text Solution

    |

  13. Calcualte the mean deviation about the mean for the following frequenc...

    Text Solution

    |

  14. Calcualte the mean deviation from the median of the following data :

    Text Solution

    |

  15. Determine the mean and standard deviation for the following distributi...

    Text Solution

    |

  16. The weights of coffee in 70 jars is shown in the following table: ...

    Text Solution

    |

  17. Determine mean and standard deviation of first n terms of an A.P. whos...

    Text Solution

    |

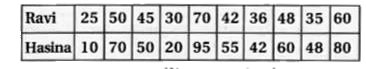
  18. Following are the marks obtained , out of 100 by two students ravi and...

    Text Solution

    |

  19. Mean and standard deviation of 100 observations were found to be 40 an...

    Text Solution

    |

  20. While calculating the mean and variance of 10 readings, a student wron...

    Text Solution

    |