A
B
C
D
Text Solution
Verified by Experts
The correct Answer is:


Similar Questions
Explore conceptually related problems
Recommended Questions
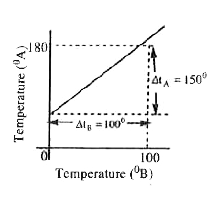
- The graph between two temperature scales A and B is shown in Fig. 11.1...
Text Solution
|
- The graph between two temperature scales A and B is shown in Fig. Betw...
Text Solution
|
- A faulty thermometer has its lower fixed point marked as 110^(@) and u...
Text Solution
|
- सेल्सियस थर्मामीटर के निम्न नियत बिंदु और ऊपरी नियत बिंदु क्या है?
Text Solution
|
- What are the lower and upper fixing points in Celsius and Fabrcnheit s...
Text Solution
|
- फॉरेनहाइट स्केल का निम्न नियत बिन्दु तथा ऊपरी नियत बिन्दु होता है
Text Solution
|
- The graph between two temperature scales A and B is shown in figure. B...
Text Solution
|
- The graph between two temperature scales A and B is shown in Fig. Betw...
Text Solution
|
- Passage - I: The graph between two temperature scales A and B is as sh...
Text Solution
|