A
B
C
D
Text Solution
Verified by Experts
The correct Answer is:


Similar Questions
Explore conceptually related problems
Recommended Questions
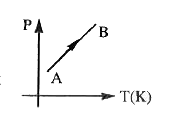
- The P-T graph for the given mass of an ideal gas is shown in figure. T...
Text Solution
|
- The P-T graph for the given mass of an ideal gas is shown in figure. T...
Text Solution
|
- The volume-temperature graphs of a given mass of an ideal gas at const...
Text Solution
|
- The p-T graph for the given mass of an ideal gas is shown in figure. W...
Text Solution
|
- If P, V, M, T and R are symbols of pressure, volume, molecular weight,...
Text Solution
|
- A plot of P vs T for a given mass of gas at constant volume is a strai...
Text Solution
|
- P-T graphs of an ideal gas are as shown in figures-2.42 below. Choose ...
Text Solution
|
- स्थिर दाब पर आदर्श गैस के दिये गए द्रव्यमान का आयतन तापमान ग्राफ नीचे ...
Text Solution
|
- The graph of P vs T is a straight line for a given mass of a gas at a ...
Text Solution
|